
Search for Indicators
CHIP 2019-2023 Indicators
Indicator Gauge Icon Legend
Legend Colors
Red is bad, green is good, blue is not statistically different/neutral.
Compared to Distribution
 the value is in the best half of communities.
 the value is in the 2nd worst quarter of communities.
 the value is in the worst quarter of communities.
Compared to Target
 meets target;
  does not meet target.
Compared to a Single Value
 lower than the comparison value;
 higher than the comparison value;
 not statistically different from comparison value.
Trend

 non-significant change over time;
 significant change over time;
  no change over time.
Compared to Prior Value
 higher than the previous measurement period;
 lower than the previous measurement period;
 no statistically different change from previous measurement period.
 Significantly better than the overall value
 Significantly worse than the overall value
 Significantly different than the overall value
 No significant difference with the overall value
 No data on significance available
Healthy Eating
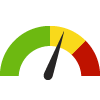
Child Food Insecurity Rate County/City: Fairfax County
Child Food Insecurity Rate County/City: Fairfax County
2.2%
(2021)
Compared to:
VA Counties
The distribution is based on data from 133 Virginia counties and county equivalents.
U.S. Counties
The distribution is based on data from 3,140 U.S. counties and county equivalents.
VA Value
(8.8%)
The regional value is compared to the Virginia State value.
US Value
(12.8%)
The regional value is compared to the national value.
Prior Value
(4.6%)
Prior Value compares a measured value with the previously measured value. Confidence intervals were not taken into account in determining the direction of the comparison.
Trend
This comparison measures the indicator’s values over multiple time periods.<br>The Mann-Kendall Test for Statistical Significance is used to evaluate the trend<br>over 4 to 10 periods of measure, subject to data availability and comparability.
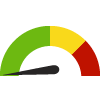
Food Insecurity Rate County/City: Fairfax County
Food Insecurity Rate County/City: Fairfax County
5.8%
(2021)
Compared to:


VA Counties
The distribution is based on data from 133 Virginia counties and county equivalents.
U.S. Counties
The distribution is based on data from 3,140 U.S. counties and county equivalents.
VA Value
(8.1%)
The regional value is compared to the Virginia State value.
US Value
(10.4%)
The regional value is compared to the national value.
Prior Value
(5.7%)
Prior Value compares a measured value with the previously measured value. Confidence intervals were not taken into account in determining the direction of the comparison.
Trend
This comparison measures the indicator’s values over multiple time periods.<br>The Mann-Kendall Test for Statistical Significance is used to evaluate the trend<br>over 4 to 10 periods of measure, subject to data availability and comparability.
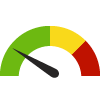
Adults 20+ Who Are Obese County/City: Fairfax County
Adults 20+ Who Are Obese County/City: Fairfax County
22.5%
(2021)
Compared to:
VA Counties
The distribution is based on data from 133 Virginia counties and county equivalents.
U.S. Counties
The distribution is based on data from 3,074 U.S. counties and county equivalents.
Prior Value
(21.4%)
Prior Value compares a measured value with the previously measured value. Confidence intervals were taken into account in determining the direction of the comparison.
Trend
This comparison measures the indicator’s values over multiple time periods.<br>The Mann-Kendall Test for Statistical Significance is used to evaluate the trend<br>over 4 to 10 periods of measure, subject to data availability and comparability.
HP 2030 Target
(36.0%)
Healthy Environment & Active Living
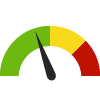
Access to Exercise Opportunities County/City: Fairfax County
Access to Exercise Opportunities County/City: Fairfax County
99.8%
(2024)
Compared to:
VA Counties
The distribution is based on data from 133 Virginia counties and county equivalents.
U.S. Counties
The distribution is based on data from 3,096 U.S. counties and county equivalents.
VA Value
(83.6%)
The regional value is compared to the Virginia State value.
US Value
(84.1%)
The regional value is compared to the national value.
Prior Value
(99.7%)
Prior Value compares a measured value with the previously measured value. Confidence intervals were not taken into account in determining the direction of the comparison.
Access to Parks County/City: Fairfax County
Access to Parks County/City: Fairfax County
95.3%
(2020)
Compared to:
VA Counties
The distribution is based on data from 133 Virginia counties and county equivalents.
VA Value
(78.5%)
The regional value is compared to the Virginia State value.
Prior Value
(93.5%)
Prior Value compares a measured value with the previously measured value. Confidence intervals were not taken into account in determining the direction of the comparison.
Workers who Walk to Work County/City: Fairfax County
Workers who Walk to Work County/City: Fairfax County
1.6%
(2018-2022)
Compared to:


VA Counties
The distribution is based on data from 133 Virginia counties and county equivalents.
U.S. Counties
The distribution is based on data from 3,133 U.S. counties and county equivalents.
VA Value
(2.1%)
The regional value is compared to the Virginia State value.
US Value
(2.4%)
The regional value is compared to the national value.
Trend
This comparison measures the indicator’s values over multiple time periods.<br>The Mann-Kendall Test for Statistical Significance is used to evaluate the trend<br>over 4 to 10 periods of measure, subject to data availability and comparability.
Adults Engaging in Physical Activity Health District: Fairfax
Adults Engaging in Physical Activity Health District: Fairfax
86.8%
(2021)
Compared to:
VA Health Districts
The distribution is based on data from 28 Virginia health districts.
VA Value
(79.1%)
The regional value is compared to the Virginia State value.
US Value
(76.3%)
The regional value is compared to the national value. The source for the national value is Behavioral Risk Factor Surveillance System
Prior Value
(85.4%)
Prior Value compares a measured value with the previously measured value. Confidence intervals were taken into account in determining the direction of the comparison.
Trend
This comparison measures the indicator’s values over multiple time periods.<br>The Mann-Kendall Test for Statistical Significance is used to evaluate the trend<br>over 4 to 10 periods of measure, subject to data availability and comparability.
Promoting Behavioral Health
Adults who Drink Excessively County/City: Fairfax County
Adults who Drink Excessively County/City: Fairfax County
16.0%
(2021)
Compared to:
VA Counties
The distribution is based on data from 133 Virginia counties and county equivalents.
U.S. Counties
The distribution is based on data from 3,141 U.S. counties and county equivalents.
VA Value
(17.8%)
The regional value is compared to the Virginia State value.
US Value
(18.1%)
The regional value is compared to the national value.
Prior Value
(16.9%)
Prior Value compares a measured value with the previously measured value. Confidence intervals were taken into account in determining the direction of the comparison.
Trend
This comparison measures the indicator’s values over multiple time periods.<br>The Mann-Kendall Test for Statistical Significance is used to evaluate the trend<br>over 4 to 10 periods of measure, subject to data availability and comparability.
Frequent Mental Distress County/City: Fairfax County
Frequent Mental Distress County/City: Fairfax County
10.1%
(2019)
Compared to:
VA Counties
The distribution is based on data from 133 Virginia counties and county equivalents.
U.S. Counties
The distribution is based on data from 3,121 U.S. counties and county equivalents.
VA Value
(13.0%)
The regional value is compared to the Virginia State value.
US Value
(14.0%)
The regional value is compared to the national value.
Prior Value
(9.9%)
Prior Value compares a measured value with the previously measured value. Confidence intervals were taken into account in determining the direction of the comparison.
Poor Mental Health: 14+ Days County/City: Fairfax County
Poor Mental Health: 14+ Days County/City: Fairfax County
11.5%
(2021)
Compared to:
VA Counties
The distribution is based on data from 133 Virginia counties and county equivalents.
U.S. Counties
The distribution is based on data from 3,074 U.S. counties and county equivalents.
US Value
(14.7%)
The regional value is compared to the national value.
Death Rate due to Drug Poisoning County/City: Fairfax County
Death Rate due to Drug Poisoning County/City: Fairfax County
10.0
Deaths per 100,000 population
(2019-2021)
Compared to:
VA Counties
The distribution is based on data from 104 Virginia counties and county equivalents.
U.S. Counties
The distribution is based on data from 1,899 U.S. counties and county equivalents.
VA Value
(24.9)
The regional value is compared to the Virginia State value.
US Value
(27.2)
The regional value is compared to the national value.
HP 2030 Target
(20.7)
<div>SU-03: Reduce drug overdose deaths <strong>(LEADING HEALTH INDICATOR)</strong></div>
