
Search for Indicators
All Data
The Fairfax Health District includes Fairfax County, Virginia, and the cities of Fairfax and Falls Church.
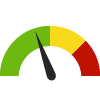
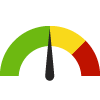
Indicator Gauge Icon Legend
Legend Colors
Red is bad, green is good, blue is not statistically different/neutral.
Compared to Distribution
 the value is in the best half of communities.
 the value is in the 2nd worst quarter of communities.
 the value is in the worst quarter of communities.
Compared to Target
 meets target;
  does not meet target.
Compared to a Single Value
 lower than the comparison value;
 higher than the comparison value;
 not statistically different from comparison value.
Trend

 non-significant change over time;
 significant change over time;
  no change over time.
Compared to Prior Value
 higher than the previous measurement period;
 lower than the previous measurement period;
 no statistically different change from previous measurement period.
County/City: Fairfax City
Health / Alcohol & Drug Use
Value
Compared to:
County/City: Fairfax City Adults who Binge Drink
County/City: Fairfax City Adults who Binge Drink
16.1%
(2021)
Compared to:


VA Counties
The distribution is based on data from 133 Virginia counties and county equivalents.
U.S. Counties
The distribution is based on data from 3,074 U.S. counties and county equivalents.
US Value
(15.5%)
The regional value is compared to the national value.
County/City: Fairfax City Adults who Drink Excessively
County/City: Fairfax City Adults who Drink Excessively
16.9%
(2020)
Compared to:

VA Counties
The distribution is based on data from 133 Virginia counties and county equivalents.
U.S. Counties
The distribution is based on data from 3,140 U.S. counties and county equivalents.
VA Value
(16.9%)
The regional value is compared to the Virginia State value.
US Value
(19.0%)
The regional value is compared to the national value.
Prior Value
(19.4%)
Prior Value compares a measured value with the previously measured value. Confidence intervals were taken into account in determining the direction of the comparison.
County/City: Fairfax City Age-Adjusted Hospitalization Rate due to Adult Alcohol Use
County/City: Fairfax City Age-Adjusted Hospitalization Rate due to Adult Alcohol Use
28.8
Hospitalizations per 10,000 population 18+ years
(2020-2022)
Compared to:

VA Counties
The distribution is based on data from 128 Virginia counties and county equivalents.
VA Value
(17.5)
The regional value is compared to the Virginia State value.
Prior Value
(24.8)
Prior Value compares a measured value with the previously measured value. Confidence intervals were taken into account in determining the direction of the comparison.
Trend
This comparison measures the indicator’s values over multiple time periods.<br>The Mann-Kendall Test for Statistical Significance is used to evaluate the trend<br>over 4 to 10 periods of measure, subject to data availability and comparability.
County/City: Fairfax City Age-Adjusted Hospitalization Rate due to Opioid Use
County/City: Fairfax City Age-Adjusted Hospitalization Rate due to Opioid Use
7.4
Hospitalizations per 10,000 population 18+ years
(2020-2022)
Compared to:

VA Counties
The distribution is based on data from 83 Virginia counties and county equivalents.
VA Value
(4.8)
The regional value is compared to the Virginia State value.
Prior Value
(5.5)
Prior Value compares a measured value with the previously measured value. Confidence intervals were taken into account in determining the direction of the comparison.
Trend
This comparison measures the indicator’s values over multiple time periods.<br>The Mann-Kendall Test for Statistical Significance is used to evaluate the trend<br>over 4 to 10 periods of measure, subject to data availability and comparability.
County/City: Fairfax City Death Rate due to Drug Poisoning
County/City: Fairfax City Death Rate due to Drug Poisoning
20.8
Deaths per 100,000 population
(2018-2020)
Compared to:

VA Counties
The distribution is based on data from 92 Virginia counties and county equivalents.
U.S. Counties
The distribution is based on data from 1,797 U.S. counties and county equivalents.
VA Value
(20.4)
The regional value is compared to the Virginia State value.
US Value
(23.0)
The regional value is compared to the national value.
Prior Value
(20.6)
Prior Value compares a measured value with the previously measured value. Confidence intervals were taken into account in determining the direction of the comparison.
Trend
This comparison measures the indicator’s values over multiple time periods.<br>The Mann-Kendall Test for Statistical Significance is used to evaluate the trend<br>over 4 to 10 periods of measure, subject to data availability and comparability.
HP 2030 Target
(20.7)
<div>SU-03: Reduce drug overdose deaths <strong>(LEADING HEALTH INDICATOR)</strong></div>
County/City: Fairfax City Death Rate due to Fentanyl Overdose
County/City: Fairfax City Death Rate due to Fentanyl Overdose
0.0
Deaths per 100,000 population
(2022)
Compared to:

VA Counties
The distribution is based on data from 133 Virginia counties and county equivalents.
VA Value
(23.1)
The regional value is compared to the Virginia State value.
Prior Value
(12.8)
Prior Value compares a measured value with the previously measured value. Confidence intervals were not taken into account in determining the direction of the comparison.
Trend
This comparison measures the indicator’s values over multiple time periods.<br>The Mann-Kendall Test for Statistical Significance is used to evaluate the trend<br>over 4 to 10 periods of measure, subject to data availability and comparability.
County/City: Fairfax City Death Rate due to Heroin Overdose
County/City: Fairfax City Death Rate due to Heroin Overdose
0.0
Deaths per 100,000 population
(2022)
Compared to:
VA Counties
(2021)
The distribution is based on data from 133 Virginia counties and county equivalents.
VA Value
(3.0)
The regional value is compared to the Virginia State value.
Prior Value
(4.3)
Prior Value compares a measured value with the previously measured value. Confidence intervals were not taken into account in determining the direction of the comparison.
Trend
This comparison measures the indicator’s values over multiple time periods.<br>The Mann-Kendall Test for Statistical Significance is used to evaluate the trend<br>over 4 to 10 periods of measure, subject to data availability and comparability.
County/City: Fairfax City Death Rate due to Prescription Opioid Overdose
County/City: Fairfax City Death Rate due to Prescription Opioid Overdose
0.0
Deaths per 100,000 population
(2018)
Compared to:
VA Value
(11.0)
The regional value is compared to the Virginia State value.
Prior Value
(12.4)
Prior Value compares a measured value with the previously measured value. Confidence intervals were not taken into account in determining the direction of the comparison.
Trend
This comparison measures the indicator’s values over multiple time periods.<br>The Mann-Kendall Test for Statistical Significance is used to evaluate the trend<br>over 4 to 10 periods of measure, subject to data availability and comparability.
County/City: Fairfax City Emergency Department Admission Rate due to Heroin
County/City: Fairfax City Emergency Department Admission Rate due to Heroin
0.3
Admissions per 10,000 population
(2023)
Compared to:
VA Counties
The distribution is based on data from 133 Virginia counties and county equivalents.
VA Value
(2.8)
The regional value is compared to the Virginia State value.
Prior Value
(1.0)
Prior Value compares a measured value with the previously measured value. Confidence intervals were not taken into account in determining the direction of the comparison.
Trend
This comparison measures the indicator’s values over multiple time periods.<br>The Mann-Kendall Test for Statistical Significance is used to evaluate the trend<br>over 4 to 10 periods of measure, subject to data availability and comparability.
County/City: Fairfax City Emergency Department Admission Rate due to Opioids
County/City: Fairfax City Emergency Department Admission Rate due to Opioids
22.9
Admissions per 10,000 population
(2023)
Compared to:

VA Counties
The distribution is based on data from 133 Virginia counties and county equivalents.
VA Value
(30.4)
The regional value is compared to the Virginia State value.
Prior Value
(20.5)
Prior Value compares a measured value with the previously measured value. Confidence intervals were not taken into account in determining the direction of the comparison.
Trend
This comparison measures the indicator’s values over multiple time periods.<br>The Mann-Kendall Test for Statistical Significance is used to evaluate the trend<br>over 4 to 10 periods of measure, subject to data availability and comparability.
County/City: Fairfax City
Health / Cancer
Value
Compared to:
County/City: Fairfax City Adults with Cancer
County/City: Fairfax City Adults with Cancer
6.5%
(2021)
Compared to:

VA Counties
The distribution is based on data from 133 Virginia counties and county equivalents.
U.S. Counties
The distribution is based on data from 3,074 U.S. counties and county equivalents.
US Value
(7.0%)
The regional value is compared to the national value.
County/City: Fairfax City Age-Adjusted Death Rate due to Breast Cancer
County/City: Fairfax City Age-Adjusted Death Rate due to Breast Cancer
26.3
Deaths per 100,000 females
(2016-2020)
Compared to:
VA Counties
The distribution is based on data from 83 Virginia counties and county equivalents.
U.S. Counties
The distribution is based on data from 1,755 U.S. counties and county equivalents.
VA Value
(20.6)
The regional value is compared to the Virginia State value.
US Value
(19.6)
The regional value is compared to the national value.
Prior Value
(30.3)
Prior Value compares a measured value with the previously measured value. Confidence intervals were taken into account in determining the direction of the comparison.
Trend
This comparison measures the indicator’s values over multiple time periods.<br>The Mann-Kendall Test for Statistical Significance is used to evaluate the trend<br>over 4 to 10 periods of measure, subject to data availability and comparability.
HP 2030 Target
(15.3)
County/City: Fairfax City Age-Adjusted Death Rate due to Cancer
County/City: Fairfax City Age-Adjusted Death Rate due to Cancer
205.4
Deaths per 100,000 population
(2016-2020)
Compared to:
VA Counties
The distribution is based on data from 132 Virginia counties and county equivalents.
U.S. Counties
The distribution is based on data from 3,085 U.S. counties and county equivalents.
VA Value
(149.7)
The regional value is compared to the Virginia State value.
US Value
(149.4)
The regional value is compared to the national value.
Prior Value
(214.3)
Prior Value compares a measured value with the previously measured value. Confidence intervals were taken into account in determining the direction of the comparison.
Trend
This comparison measures the indicator’s values over multiple time periods.<br>The Mann-Kendall Test for Statistical Significance is used to evaluate the trend<br>over 4 to 10 periods of measure, subject to data availability and comparability.
HP 2030 Target
(122.7)
County/City: Fairfax City Age-Adjusted Death Rate due to Colorectal Cancer
County/City: Fairfax City Age-Adjusted Death Rate due to Colorectal Cancer
26.2
Deaths per 100,000 population
(2016-2020)
Compared to:
VA Counties
The distribution is based on data from 98 Virginia counties and county equivalents.
U.S. Counties
The distribution is based on data from 2,174 U.S. counties and county equivalents.
VA Value
(13.2)
The regional value is compared to the Virginia State value.
US Value
(13.1)
The regional value is compared to the national value.
Prior Value
(25.0)
Prior Value compares a measured value with the previously measured value. Confidence intervals were taken into account in determining the direction of the comparison.
Trend
This comparison measures the indicator’s values over multiple time periods.<br>The Mann-Kendall Test for Statistical Significance is used to evaluate the trend<br>over 4 to 10 periods of measure, subject to data availability and comparability.
HP 2030 Target
(8.9)
County/City: Fairfax City Age-Adjusted Death Rate due to Lung Cancer
County/City: Fairfax City Age-Adjusted Death Rate due to Lung Cancer
39.6
Deaths per 100,000 population
(2016-2020)
Compared to:
VA Counties
The distribution is based on data from 127 Virginia counties and county equivalents.
U.S. Counties
The distribution is based on data from 2,752 U.S. counties and county equivalents.
VA Value
(35.3)
The regional value is compared to the Virginia State value.
US Value
(35.0)
The regional value is compared to the national value.
Prior Value
(37.2)
Prior Value compares a measured value with the previously measured value. Confidence intervals were taken into account in determining the direction of the comparison.
Trend
This comparison measures the indicator’s values over multiple time periods.<br>The Mann-Kendall Test for Statistical Significance is used to evaluate the trend<br>over 4 to 10 periods of measure, subject to data availability and comparability.
HP 2030 Target
(25.1)
County/City: Fairfax City Age-Adjusted Death Rate due to Prostate Cancer
County/City: Fairfax City Age-Adjusted Death Rate due to Prostate Cancer
34.4
Deaths per 100,000 males
(2016-2020)
Compared to:
U.S. Counties
The distribution is based on data from 1,576 U.S. counties and county equivalents.
VA Value
(20.0)
The regional value is compared to the Virginia State value.
US Value
(18.8)
The regional value is compared to the national value.
Prior Value
(32.2)
Prior Value compares a measured value with the previously measured value. Confidence intervals were taken into account in determining the direction of the comparison.
HP 2030 Target
(16.9)
County/City: Fairfax City Cancer: Medicare Population
County/City: Fairfax City Cancer: Medicare Population
12.0%
(2022)
Compared to:
VA Counties
The distribution is based on data from 133 Virginia counties and county equivalents.
U.S. Counties
The distribution is based on data from 3,129 U.S. counties and county equivalents.
VA Value
(12.0%)
The regional value is compared to the Virginia State value.
US Value
(12.0%)
The regional value is compared to the national value.
Prior Value
(11.0%)
Prior Value compares a measured value with the previously measured value. Confidence intervals were not taken into account in determining the direction of the comparison.
Trend
This comparison measures the indicator’s values over multiple time periods.<br>The Mann-Kendall Test for Statistical Significance is used to evaluate the trend<br>over 4 to 10 periods of measure, subject to data availability and comparability.
County/City: Fairfax City Cervical Cancer Screening: 21-65
County/City: Fairfax City Cervical Cancer Screening: 21-65
83.0%
(2020)
Compared to:
VA Counties
The distribution is based on data from 133 Virginia counties and county equivalents.
U.S. Counties
The distribution is based on data from 3,141 U.S. counties and county equivalents.
US Value
(82.8%)
The regional value is compared to the national value.
County/City: Fairfax City Colon Cancer Screening
County/City: Fairfax City Colon Cancer Screening
67.3%
(2018)
Compared to:
VA Counties
The distribution is based on data from 133 Virginia counties and county equivalents.
U.S. Counties
The distribution is based on data from 3,142 U.S. counties and county equivalents.
US Value
(66.4%)
The regional value is compared to the national value.
County/City: Fairfax City Colon Cancer Screening: USPSTF Recommendation
County/City: Fairfax City Colon Cancer Screening: USPSTF Recommendation
74.4%
(2020)
Compared to:
VA Counties
The distribution is based on data from 133 Virginia counties and county equivalents.
U.S. Counties
The distribution is based on data from 3,141 U.S. counties and county equivalents.
US Value
(72.4%)
The regional value is compared to the national value.
County/City: Fairfax City Mammogram in Past 2 Years: 50-74
County/City: Fairfax City Mammogram in Past 2 Years: 50-74
77.4%
(2020)
Compared to:

VA Counties
The distribution is based on data from 133 Virginia counties and county equivalents.
U.S. Counties
The distribution is based on data from 3,141 U.S. counties and county equivalents.
US Value
(78.2%)
The regional value is compared to the national value.
HP 2030 Target
(80.3%)
County/City: Fairfax City Mammography Screening: Medicare Population
County/City: Fairfax City Mammography Screening: Medicare Population
38.0%
(2022)
Compared to:


VA Counties
The distribution is based on data from 133 Virginia counties and county equivalents.
U.S. Counties
The distribution is based on data from 3,123 U.S. counties and county equivalents.
VA Value
(47.0%)
The regional value is compared to the Virginia State value.
US Value
(47.0%)
The regional value is compared to the national value.
Prior Value
(39.0%)
Prior Value compares a measured value with the previously measured value. Confidence intervals were not taken into account in determining the direction of the comparison.
Trend
This comparison measures the indicator’s values over multiple time periods.<br>The Mann-Kendall Test for Statistical Significance is used to evaluate the trend<br>over 4 to 10 periods of measure, subject to data availability and comparability.
County/City: Fairfax City
Health / County Health Rankings
Value
Compared to:
County/City: Fairfax City Clinical Care Ranking
County/City: Fairfax City Clinical Care Ranking
22
(2023)
Compared to:
VA Counties
The distribution is based on data from 133 Virginia counties and county equivalents.
County/City: Fairfax City Health Behaviors Ranking
County/City: Fairfax City Health Behaviors Ranking
4
(2023)
Compared to:
VA Counties
The distribution is based on data from 133 Virginia counties and county equivalents.
County/City: Fairfax City Morbidity Ranking
County/City: Fairfax City Morbidity Ranking
5
(2023)
Compared to:
VA Counties
The distribution is based on data from 133 Virginia counties and county equivalents.
County/City: Fairfax City Mortality Ranking
County/City: Fairfax City Mortality Ranking
49
(2023)
Compared to:
VA Counties
The distribution is based on data from 133 Virginia counties and county equivalents.
County/City: Fairfax City Physical Environment Ranking
County/City: Fairfax City Physical Environment Ranking
106
(2023)
Compared to:
VA Counties
The distribution is based on data from 133 Virginia counties and county equivalents.
County/City: Fairfax City Social and Economic Factors Ranking
County/City: Fairfax City Social and Economic Factors Ranking
7
(2023)
Compared to:
VA Counties
The distribution is based on data from 133 Virginia counties and county equivalents.
County/City: Fairfax City
Health / Diabetes
Value
Compared to:
County/City: Fairfax City Adults 20+ with Diabetes
County/City: Fairfax City Adults 20+ with Diabetes
7.6%
(2021)
Compared to:
VA Counties
The distribution is based on data from 133 Virginia counties and county equivalents.
U.S. Counties
The distribution is based on data from 3,074 U.S. counties and county equivalents.
Prior Value
(9.3%)
Prior Value compares a measured value with the previously measured value. Confidence intervals were taken into account in determining the direction of the comparison.
Trend
This comparison measures the indicator’s values over multiple time periods.<br>The Mann-Kendall Test for Statistical Significance is used to evaluate the trend<br>over 4 to 10 periods of measure, subject to data availability and comparability.
County/City: Fairfax City Age-Adjusted Hospitalization Rate due to Diabetes
County/City: Fairfax City Age-Adjusted Hospitalization Rate due to Diabetes
16.1
Hospitalizations per 10,000 population 18+ years
(2020-2022)
Compared to:
VA Counties
The distribution is based on data from 130 Virginia counties and county equivalents.
VA Value
(19.3)
The regional value is compared to the Virginia State value.
Prior Value
(14.4)
Prior Value compares a measured value with the previously measured value. Confidence intervals were taken into account in determining the direction of the comparison.
Trend
This comparison measures the indicator’s values over multiple time periods.<br>The Mann-Kendall Test for Statistical Significance is used to evaluate the trend<br>over 4 to 10 periods of measure, subject to data availability and comparability.
County/City: Fairfax City Age-Adjusted Hospitalization Rate due to Long-Term Complications of Diabetes
County/City: Fairfax City Age-Adjusted Hospitalization Rate due to Long-Term Complications of Diabetes
8.5
Hospitalizations per 10,000 population 18+ years
(2020-2022)
Compared to:
VA Counties
The distribution is based on data from 126 Virginia counties and county equivalents.
VA Value
(8.7)
The regional value is compared to the Virginia State value.
Prior Value
(7.6)
Prior Value compares a measured value with the previously measured value. Confidence intervals were taken into account in determining the direction of the comparison.
Trend
This comparison measures the indicator’s values over multiple time periods.<br>The Mann-Kendall Test for Statistical Significance is used to evaluate the trend<br>over 4 to 10 periods of measure, subject to data availability and comparability.
County/City: Fairfax City Age-Adjusted Hospitalization Rate due to Short-Term Complications of Diabetes
County/City: Fairfax City Age-Adjusted Hospitalization Rate due to Short-Term Complications of Diabetes
5.1
Hospitalizations per 10,000 population 18+ years
(2020-2022)
Compared to:
VA Counties
The distribution is based on data from 120 Virginia counties and county equivalents.
VA Value
(7.9)
The regional value is compared to the Virginia State value.
Prior Value
(4.8)
Prior Value compares a measured value with the previously measured value. Confidence intervals were taken into account in determining the direction of the comparison.
Trend
This comparison measures the indicator’s values over multiple time periods.<br>The Mann-Kendall Test for Statistical Significance is used to evaluate the trend<br>over 4 to 10 periods of measure, subject to data availability and comparability.
County/City: Fairfax City Age-Adjusted Hospitalization Rate due to Type 2 Diabetes
County/City: Fairfax City Age-Adjusted Hospitalization Rate due to Type 2 Diabetes
12.8
Hospitalizations per 10,000 population 18+ years
(2020-2022)
Compared to:
VA Counties
The distribution is based on data from 129 Virginia counties and county equivalents.
VA Value
(14.1)
The regional value is compared to the Virginia State value.
Prior Value
(12.0)
Prior Value compares a measured value with the previously measured value. Confidence intervals were taken into account in determining the direction of the comparison.
Trend
This comparison measures the indicator’s values over multiple time periods.<br>The Mann-Kendall Test for Statistical Significance is used to evaluate the trend<br>over 4 to 10 periods of measure, subject to data availability and comparability.
County/City: Fairfax City Age-Adjusted Hospitalization Rate due to Uncontrolled Diabetes
County/City: Fairfax City Age-Adjusted Hospitalization Rate due to Uncontrolled Diabetes
2.5
Hospitalizations per 10,000 population 18+ years
(2020-2022)
Compared to:
VA Counties
The distribution is based on data from 95 Virginia counties and county equivalents.
VA Value
(2.8)
The regional value is compared to the Virginia State value.
Prior Value
(2.0)
Prior Value compares a measured value with the previously measured value. Confidence intervals were taken into account in determining the direction of the comparison.
Trend
This comparison measures the indicator’s values over multiple time periods.<br>The Mann-Kendall Test for Statistical Significance is used to evaluate the trend<br>over 4 to 10 periods of measure, subject to data availability and comparability.
County/City: Fairfax City Diabetes: Medicare Population
County/City: Fairfax City Diabetes: Medicare Population
20.0%
(2022)
Compared to:
VA Counties
The distribution is based on data from 133 Virginia counties and county equivalents.
U.S. Counties
The distribution is based on data from 3,129 U.S. counties and county equivalents.
VA Value
(25.0%)
The regional value is compared to the Virginia State value.
US Value
(24.0%)
The regional value is compared to the national value.
Prior Value
(20.0%)
Prior Value compares a measured value with the previously measured value. Confidence intervals were not taken into account in determining the direction of the comparison.
Trend
This comparison measures the indicator’s values over multiple time periods.<br>The Mann-Kendall Test for Statistical Significance is used to evaluate the trend<br>over 4 to 10 periods of measure, subject to data availability and comparability.
County/City: Fairfax City Diabetic Monitoring: Medicare Population
County/City: Fairfax City Diabetic Monitoring: Medicare Population
90.9%
(2019)
Compared to:
VA Counties
The distribution is based on data from 131 Virginia counties and county equivalents.
U.S. Counties
The distribution is based on data from 3,097 U.S. counties and county equivalents.
VA Value
(89.0%)
The regional value is compared to the Virginia State value.
US Value
(87.5%)
The regional value is compared to the national value.
Prior Value
(88.1%)
Prior Value compares a measured value with the previously measured value. Confidence intervals were taken into account in determining the direction of the comparison.
Trend
This comparison measures the indicator’s values over multiple time periods.<br>The Mann-Kendall Test for Statistical Significance is used to evaluate the trend<br>over 4 to 10 periods of measure, subject to data availability and comparability.
County/City: Fairfax City
Health / Disabilities
Value
Compared to:
County/City: Fairfax City Adults with Disability Living in Poverty
County/City: Fairfax City Adults with Disability Living in Poverty
30.7%
(2018-2022)
Compared to:
VA Counties
The distribution is based on data from 133 Virginia counties and county equivalents.
U.S. Counties
The distribution is based on data from 3,132 U.S. counties and county equivalents.
VA Value
(21.1%)
The regional value is compared to the Virginia State value.
US Value
(24.9%)
The regional value is compared to the national value.
Trend
This comparison measures the indicator’s values over multiple time periods.<br>The Mann-Kendall Test for Statistical Significance is used to evaluate the trend<br>over 4 to 10 periods of measure, subject to data availability and comparability.
County/City: Fairfax City Children with a Disability
County/City: Fairfax City Children with a Disability
3.6%
(2018-2022)
Compared to:


VA Value
(4.5%)
The regional value is compared to the Virginia State value.
US Value
(4.5%)
The regional value is compared to the national value.
Trend
This comparison measures the indicator’s values over multiple time periods.<br>The Mann-Kendall Test for Statistical Significance is used to evaluate the trend<br>over 4 to 10 periods of measure, subject to data availability and comparability.
County/City: Fairfax City Persons with a Cognitive Difficulty
County/City: Fairfax City Persons with a Cognitive Difficulty
4.1%
(2018-2022)
Compared to:

VA Value
(4.8%)
The regional value is compared to the Virginia State value.
US Value
(5.3%)
The regional value is compared to the national value.
Trend
This comparison measures the indicator’s values over multiple time periods.<br>The Mann-Kendall Test for Statistical Significance is used to evaluate the trend<br>over 4 to 10 periods of measure, subject to data availability and comparability.
County/City: Fairfax City Persons with a Disability
County/City: Fairfax City Persons with a Disability
7.2%
(2018-2022)
Compared to:

VA Value
(12.1%)
The regional value is compared to the Virginia State value.
US Value
(12.9%)
The regional value is compared to the national value.
Trend
This comparison measures the indicator’s values over multiple time periods.<br>The Mann-Kendall Test for Statistical Significance is used to evaluate the trend<br>over 4 to 10 periods of measure, subject to data availability and comparability.
County/City: Fairfax City Persons with a Hearing Difficulty
County/City: Fairfax City Persons with a Hearing Difficulty
2.1%
(2018-2022)
Compared to:
VA Value
(3.4%)
The regional value is compared to the Virginia State value.
US Value
(3.6%)
The regional value is compared to the national value.
Trend
This comparison measures the indicator’s values over multiple time periods.<br>The Mann-Kendall Test for Statistical Significance is used to evaluate the trend<br>over 4 to 10 periods of measure, subject to data availability and comparability.
County/City: Fairfax City Persons with a Self-Care Difficulty
County/City: Fairfax City Persons with a Self-Care Difficulty
1.6%
(2018-2022)
Compared to:
VA Value
(2.4%)
The regional value is compared to the Virginia State value.
US Value
(2.6%)
The regional value is compared to the national value.
Trend
This comparison measures the indicator’s values over multiple time periods.<br>The Mann-Kendall Test for Statistical Significance is used to evaluate the trend<br>over 4 to 10 periods of measure, subject to data availability and comparability.
County/City: Fairfax City Persons with a Vision Difficulty
County/City: Fairfax City Persons with a Vision Difficulty
1.3%
(2018-2022)
Compared to:
VA Value
(2.2%)
The regional value is compared to the Virginia State value.
US Value
(2.4%)
The regional value is compared to the national value.
Trend
This comparison measures the indicator’s values over multiple time periods.<br>The Mann-Kendall Test for Statistical Significance is used to evaluate the trend<br>over 4 to 10 periods of measure, subject to data availability and comparability.
County/City: Fairfax City Persons with an Ambulatory Difficulty
County/City: Fairfax City Persons with an Ambulatory Difficulty
2.6%
(2018-2022)
Compared to:
VA Value
(6.3%)
The regional value is compared to the Virginia State value.
US Value
(6.7%)
The regional value is compared to the national value.
Trend
This comparison measures the indicator’s values over multiple time periods.<br>The Mann-Kendall Test for Statistical Significance is used to evaluate the trend<br>over 4 to 10 periods of measure, subject to data availability and comparability.
County/City: Fairfax City
Health / Family Planning
Value
Compared to:
County/City: Fairfax City Teen Pregnancy Rate
County/City: Fairfax City Teen Pregnancy Rate
7.5
Pregnancies per 1,000 females aged 15-17
(2020)
Compared to:
VA Counties
The distribution is based on data from 133 Virginia counties and county equivalents.
VA Value
(7.0)
The regional value is compared to the Virginia State value.
Prior Value
(2.5)
Prior Value compares a measured value with the previously measured value. Confidence intervals were not taken into account in determining the direction of the comparison.
Trend
This comparison measures the indicator’s values over multiple time periods.<br>The Mann-Kendall Test for Statistical Significance is used to evaluate the trend<br>over 4 to 10 periods of measure, subject to data availability and comparability.
County/City: Fairfax City
Health / Health Care Access & Quality
Value
Compared to:
County/City: Fairfax City Adults who have had a Routine Checkup
County/City: Fairfax City Adults who have had a Routine Checkup
75.4%
(2021)
Compared to:
VA Counties
The distribution is based on data from 133 Virginia counties and county equivalents.
U.S. Counties
The distribution is based on data from 3,074 U.S. counties and county equivalents.
US Value
(73.6%)
The regional value is compared to the national value.
County/City: Fairfax City Adults with Health Insurance: 18-64
County/City: Fairfax City Adults with Health Insurance: 18-64
90.0%
(2021)
Compared to:
VA Counties
The distribution is based on data from 133 Virginia counties and county equivalents.
U.S. Counties
The distribution is based on data from 3,140 U.S. counties and county equivalents.
VA Value
(90.7%)
The regional value is compared to the Virginia State value.
Prior Value
(89.6%)
Prior Value compares a measured value with the previously measured value. Confidence intervals were taken into account in determining the direction of the comparison.
Trend
This comparison measures the indicator’s values over multiple time periods.<br>The Mann-Kendall Test for Statistical Significance is used to evaluate the trend<br>over 4 to 10 periods of measure, subject to data availability and comparability.
County/City: Fairfax City Children with Health Insurance
County/City: Fairfax City Children with Health Insurance
94.4%
(2021)
Compared to:
VA Counties
The distribution is based on data from 133 Virginia counties and county equivalents.
U.S. Counties
The distribution is based on data from 3,140 U.S. counties and county equivalents.
VA Value
(95.6%)
The regional value is compared to the Virginia State value.
Prior Value
(95.0%)
Prior Value compares a measured value with the previously measured value. Confidence intervals were taken into account in determining the direction of the comparison.
Trend
This comparison measures the indicator’s values over multiple time periods.<br>The Mann-Kendall Test for Statistical Significance is used to evaluate the trend<br>over 4 to 10 periods of measure, subject to data availability and comparability.
County/City: Fairfax City Medicare Healthcare Costs
County/City: Fairfax City Medicare Healthcare Costs
$8,191
Dollars per enrollee
(2015)
Compared to:

VA Value
($8,890)
The regional value is compared to the Virginia State value.
US Value
($9,729)
The regional value is compared to the national value.
Prior Value
($9,724)
Prior Value compares a measured value with the previously measured value. Confidence intervals were not taken into account in determining the direction of the comparison.
County/City: Fairfax City Non-Physician Primary Care Provider Rate
County/City: Fairfax City Non-Physician Primary Care Provider Rate
206
Providers per 100,000 population
(2022)
Compared to:
VA Counties
The distribution is based on data from 129 Virginia counties and county equivalents.
U.S. Counties
The distribution is based on data from 3,131 U.S. counties and county equivalents.
VA Value
(117)
The regional value is compared to the Virginia State value.
Prior Value
(205)
Prior Value compares a measured value with the previously measured value. Confidence intervals were not taken into account in determining the direction of the comparison.
Trend
This comparison measures the indicator’s values over multiple time periods.<br>The Mann-Kendall Test for Statistical Significance is used to evaluate the trend<br>over 4 to 10 periods of measure, subject to data availability and comparability.
County/City: Fairfax City Persons with Health Insurance
County/City: Fairfax City Persons with Health Insurance
91.3%
(2021)
Compared to:
VA Counties
The distribution is based on data from 133 Virginia counties and county equivalents.
U.S. Counties
The distribution is based on data from 3,140 U.S. counties and county equivalents.
VA Value
(92.0%)
The regional value is compared to the Virginia State value.
Prior Value
(91.1%)
Prior Value compares a measured value with the previously measured value. Confidence intervals were taken into account in determining the direction of the comparison.
Trend
This comparison measures the indicator’s values over multiple time periods.<br>The Mann-Kendall Test for Statistical Significance is used to evaluate the trend<br>over 4 to 10 periods of measure, subject to data availability and comparability.
HP 2030 Target
(92.4%)
<div>AHS-01: Increase the proportion of people with health insurance <strong>(LEADING HEALTH INDICATOR)</strong></div>
County/City: Fairfax City Preventable Hospital Stays: Medicare Population
County/City: Fairfax City Preventable Hospital Stays: Medicare Population
1,649.0
Discharges per 100,000 Medicare enrollees
(2022)
Compared to:
VA Counties
The distribution is based on data from 133 Virginia counties and county equivalents.
U.S. Counties
The distribution is based on data from 3,129 U.S. counties and county equivalents.
VA Value
(2,518.0)
The regional value is compared to the Virginia State value.
US Value
(2,677.0)
The regional value is compared to the national value.
Prior Value
(1,669.0)
Prior Value compares a measured value with the previously measured value. Confidence intervals were not taken into account in determining the direction of the comparison.
Trend
This comparison measures the indicator’s values over multiple time periods.<br>The Mann-Kendall Test for Statistical Significance is used to evaluate the trend<br>over 4 to 10 periods of measure, subject to data availability and comparability.
County/City: Fairfax City Primary Care Provider Rate
County/City: Fairfax City Primary Care Provider Rate
13
Providers per 100,000 population
(2020)
Compared to:
VA Counties
The distribution is based on data from 126 Virginia counties and county equivalents.
U.S. Counties
The distribution is based on data from 2,995 U.S. counties and county equivalents.
VA Value
(76)
The regional value is compared to the Virginia State value.
Prior Value
(12)
Prior Value compares a measured value with the previously measured value. Confidence intervals were not taken into account in determining the direction of the comparison.
Trend
This comparison measures the indicator’s values over multiple time periods.<br>The Mann-Kendall Test for Statistical Significance is used to evaluate the trend<br>over 4 to 10 periods of measure, subject to data availability and comparability.
County/City: Fairfax City
Health / Health Information Technology
Value
Compared to:
County/City: Fairfax City Households with an Internet Subscription
County/City: Fairfax City Households with an Internet Subscription
96.4%
(2018-2022)
Compared to:
VA Counties
The distribution is based on data from 133 Virginia counties and county equivalents.
U.S. Counties
The distribution is based on data from 3,133 U.S. counties and county equivalents.
VA Value
(88.9%)
The regional value is compared to the Virginia State value.
US Value
(88.5%)
The regional value is compared to the national value.
Trend
This comparison measures the indicator’s values over multiple time periods.<br>The Mann-Kendall Test for Statistical Significance is used to evaluate the trend<br>over 4 to 10 periods of measure, subject to data availability and comparability.
County/City: Fairfax City Households with One or More Types of Computing Devices
County/City: Fairfax City Households with One or More Types of Computing Devices
98.9%
(2018-2022)
Compared to:
VA Counties
The distribution is based on data from 133 Virginia counties and county equivalents.
U.S. Counties
The distribution is based on data from 3,133 U.S. counties and county equivalents.
VA Value
(94.0%)
The regional value is compared to the Virginia State value.
US Value
(94.0%)
The regional value is compared to the national value.
Trend
This comparison measures the indicator’s values over multiple time periods.<br>The Mann-Kendall Test for Statistical Significance is used to evaluate the trend<br>over 4 to 10 periods of measure, subject to data availability and comparability.
County/City: Fairfax City Persons with an Internet Subscription
County/City: Fairfax City Persons with an Internet Subscription
97.7%
(2018-2022)
Compared to:
VA Counties
The distribution is based on data from 133 Virginia counties and county equivalents.
U.S. Counties
The distribution is based on data from 3,133 U.S. counties and county equivalents.
VA Value
(91.4%)
The regional value is compared to the Virginia State value.
US Value
(91.0%)
The regional value is compared to the national value.
Trend
This comparison measures the indicator’s values over multiple time periods.<br>The Mann-Kendall Test for Statistical Significance is used to evaluate the trend<br>over 4 to 10 periods of measure, subject to data availability and comparability.
County/City: Fairfax City
Health / Heart Disease & Stroke
Value
Compared to:
County/City: Fairfax City Adults who Experienced a Stroke
County/City: Fairfax City Adults who Experienced a Stroke
2.5%
(2021)
Compared to:
VA Counties
The distribution is based on data from 133 Virginia counties and county equivalents.
U.S. Counties
The distribution is based on data from 3,074 U.S. counties and county equivalents.
US Value
(3.3%)
The regional value is compared to the national value.
County/City: Fairfax City Adults who Experienced Coronary Heart Disease
County/City: Fairfax City Adults who Experienced Coronary Heart Disease
4.7%
(2021)
Compared to:
VA Counties
The distribution is based on data from 133 Virginia counties and county equivalents.
U.S. Counties
The distribution is based on data from 3,074 U.S. counties and county equivalents.
US Value
(6.1%)
The regional value is compared to the national value.
County/City: Fairfax City Adults who Have Taken Medications for High Blood Pressure
County/City: Fairfax City Adults who Have Taken Medications for High Blood Pressure
78.2%
(2021)
Compared to:
VA Counties
The distribution is based on data from 133 Virginia counties and county equivalents.
U.S. Counties
The distribution is based on data from 3,074 U.S. counties and county equivalents.
US Value
(78.2%)
The regional value is compared to the national value.
County/City: Fairfax City Age-Adjusted Death Rate due to Cerebrovascular Disease (Stroke)
County/City: Fairfax City Age-Adjusted Death Rate due to Cerebrovascular Disease (Stroke)
54.3
Deaths per 100,000 population
(2018-2020)
Compared to:
VA Counties
The distribution is based on data from 116 Virginia counties and county equivalents.
U.S. Counties
The distribution is based on data from 2,338 U.S. counties and county equivalents.
VA Value
(39.0)
The regional value is compared to the Virginia State value.
US Value
(37.6)
The regional value is compared to the national value.
Prior Value
(49.3)
Prior Value compares a measured value with the previously measured value. Confidence intervals were taken into account in determining the direction of the comparison.
Trend
This comparison measures the indicator’s values over multiple time periods.<br>The Mann-Kendall Test for Statistical Significance is used to evaluate the trend<br>over 4 to 10 periods of measure, subject to data availability and comparability.
HP 2030 Target
(33.4)
County/City: Fairfax City Age-Adjusted Death Rate due to Heart Attack
County/City: Fairfax City Age-Adjusted Death Rate due to Heart Attack
26.1
Deaths per 100,000 population 35+ years
(2018)
Compared to:
VA Counties
The distribution is based on data from 76 Virginia counties and county equivalents.
VA Value
(47.6)
The regional value is compared to the Virginia State value.
Prior Value
(24.8)
Prior Value compares a measured value with the previously measured value. Confidence intervals were not taken into account in determining the direction of the comparison.
Trend
This comparison measures the indicator’s values over multiple time periods.<br>The Mann-Kendall Test for Statistical Significance is used to evaluate the trend<br>over 4 to 10 periods of measure, subject to data availability and comparability.
County/City: Fairfax City Age-Adjusted Death Rate due to Heart Disease
County/City: Fairfax City Age-Adjusted Death Rate due to Heart Disease
193.5
Deaths per 100,000 population
(2018-2020)
Compared to:
VA Counties
The distribution is based on data from 132 Virginia counties and county equivalents.
VA Value
(149.6)
The regional value is compared to the Virginia State value.
US Value
(92.9 in 2017)
The regional value is compared to the national value.
Prior Value
(199.5)
Prior Value compares a measured value with the previously measured value. Confidence intervals were taken into account in determining the direction of the comparison.
Trend
This comparison measures the indicator’s values over multiple time periods.<br>The Mann-Kendall Test for Statistical Significance is used to evaluate the trend<br>over 4 to 10 periods of measure, subject to data availability and comparability.
County/City: Fairfax City Age-Adjusted Hospitalization Rate due to Heart Attack
County/City: Fairfax City Age-Adjusted Hospitalization Rate due to Heart Attack
13.7
Hospitalizations per 10,000 population 35+ years
(2021)
Compared to:
VA Counties
The distribution is based on data from 128 Virginia counties and county equivalents.
VA Value
(22.5 in 2020)
The regional value is compared to the Virginia State value.
Prior Value
(11.4)
Prior Value compares a measured value with the previously measured value. Confidence intervals were not taken into account in determining the direction of the comparison.
County/City: Fairfax City Age-Adjusted Hospitalization Rate due to Heart Failure
County/City: Fairfax City Age-Adjusted Hospitalization Rate due to Heart Failure
32.5
Hospitalizations per 10,000 population 18+ years
(2020-2022)
Compared to:
VA Counties
The distribution is based on data from 131 Virginia counties and county equivalents.
VA Value
(33.3)
The regional value is compared to the Virginia State value.
Prior Value
(28.6)
Prior Value compares a measured value with the previously measured value. Confidence intervals were taken into account in determining the direction of the comparison.
Trend
This comparison measures the indicator’s values over multiple time periods.<br>The Mann-Kendall Test for Statistical Significance is used to evaluate the trend<br>over 4 to 10 periods of measure, subject to data availability and comparability.
County/City: Fairfax City Age-Adjusted Hospitalization Rate due to Hypertension
County/City: Fairfax City Age-Adjusted Hospitalization Rate due to Hypertension
3.5
Hospitalizations per 10,000 population 18+ years
(2020-2022)
Compared to:
VA Counties
The distribution is based on data from 105 Virginia counties and county equivalents.
VA Value
(4.2)
The regional value is compared to the Virginia State value.
Prior Value
(2.7)
Prior Value compares a measured value with the previously measured value. Confidence intervals were taken into account in determining the direction of the comparison.
Trend
This comparison measures the indicator’s values over multiple time periods.<br>The Mann-Kendall Test for Statistical Significance is used to evaluate the trend<br>over 4 to 10 periods of measure, subject to data availability and comparability.
County/City: Fairfax City Atrial Fibrillation: Medicare Population
County/City: Fairfax City Atrial Fibrillation: Medicare Population
13.0%
(2022)
Compared to:
VA Counties
The distribution is based on data from 133 Virginia counties and county equivalents.
U.S. Counties
The distribution is based on data from 3,129 U.S. counties and county equivalents.
VA Value
(14.0%)
The regional value is compared to the Virginia State value.
US Value
(14.0%)
The regional value is compared to the national value.
Prior Value
(13.0%)
Prior Value compares a measured value with the previously measured value. Confidence intervals were not taken into account in determining the direction of the comparison.
Trend
This comparison measures the indicator’s values over multiple time periods.<br>The Mann-Kendall Test for Statistical Significance is used to evaluate the trend<br>over 4 to 10 periods of measure, subject to data availability and comparability.
County/City: Fairfax City Cholesterol Test History
County/City: Fairfax City Cholesterol Test History
88.0%
(2021)
Compared to:
VA Counties
The distribution is based on data from 133 Virginia counties and county equivalents.
U.S. Counties
The distribution is based on data from 3,074 U.S. counties and county equivalents.
US Value
(86.4%)
The regional value is compared to the national value.
County/City: Fairfax City Heart Failure: Medicare Population
County/City: Fairfax City Heart Failure: Medicare Population
9.0%
(2022)
Compared to:
VA Counties
The distribution is based on data from 133 Virginia counties and county equivalents.
U.S. Counties
The distribution is based on data from 3,129 U.S. counties and county equivalents.
VA Value
(11.0%)
The regional value is compared to the Virginia State value.
US Value
(11.0%)
The regional value is compared to the national value.
Prior Value
(9.0%)
Prior Value compares a measured value with the previously measured value. Confidence intervals were not taken into account in determining the direction of the comparison.
Trend
This comparison measures the indicator’s values over multiple time periods.<br>The Mann-Kendall Test for Statistical Significance is used to evaluate the trend<br>over 4 to 10 periods of measure, subject to data availability and comparability.
County/City: Fairfax City High Blood Pressure Prevalence
County/City: Fairfax City High Blood Pressure Prevalence
30.2%
(2021)
Compared to:
VA Counties
The distribution is based on data from 133 Virginia counties and county equivalents.
U.S. Counties
The distribution is based on data from 3,074 U.S. counties and county equivalents.
US Value
(32.7%)
The regional value is compared to the national value.
HP 2030 Target
(41.9%)
County/City: Fairfax City High Cholesterol Prevalence: Past 5 Years
County/City: Fairfax City High Cholesterol Prevalence: Past 5 Years
36.6%
(2021)
Compared to:
VA Counties
The distribution is based on data from 133 Virginia counties and county equivalents.
U.S. Counties
The distribution is based on data from 3,074 U.S. counties and county equivalents.
US Value
(36.4%)
The regional value is compared to the national value.
County/City: Fairfax City Hyperlipidemia: Medicare Population
County/City: Fairfax City Hyperlipidemia: Medicare Population
66.0%
(2022)
Compared to:
VA Counties
The distribution is based on data from 133 Virginia counties and county equivalents.
U.S. Counties
The distribution is based on data from 3,129 U.S. counties and county equivalents.
VA Value
(68.0%)
The regional value is compared to the Virginia State value.
US Value
(65.0%)
The regional value is compared to the national value.
Prior Value
(64.0%)
Prior Value compares a measured value with the previously measured value. Confidence intervals were not taken into account in determining the direction of the comparison.
Trend
This comparison measures the indicator’s values over multiple time periods.<br>The Mann-Kendall Test for Statistical Significance is used to evaluate the trend<br>over 4 to 10 periods of measure, subject to data availability and comparability.
County/City: Fairfax City Hypertension: Medicare Population
County/City: Fairfax City Hypertension: Medicare Population
59.0%
(2022)
Compared to:
VA Counties
The distribution is based on data from 133 Virginia counties and county equivalents.
U.S. Counties
The distribution is based on data from 3,129 U.S. counties and county equivalents.
VA Value
(66.0%)
The regional value is compared to the Virginia State value.
US Value
(65.0%)
The regional value is compared to the national value.
Prior Value
(59.0%)
Prior Value compares a measured value with the previously measured value. Confidence intervals were not taken into account in determining the direction of the comparison.
Trend
This comparison measures the indicator’s values over multiple time periods.<br>The Mann-Kendall Test for Statistical Significance is used to evaluate the trend<br>over 4 to 10 periods of measure, subject to data availability and comparability.
County/City: Fairfax City Ischemic Heart Disease: Medicare Population
County/City: Fairfax City Ischemic Heart Disease: Medicare Population
17.0%
(2022)
Compared to:
VA Counties
The distribution is based on data from 133 Virginia counties and county equivalents.
U.S. Counties
The distribution is based on data from 3,129 U.S. counties and county equivalents.
VA Value
(19.0%)
The regional value is compared to the Virginia State value.
US Value
(21.0%)
The regional value is compared to the national value.
Prior Value
(17.0%)
Prior Value compares a measured value with the previously measured value. Confidence intervals were not taken into account in determining the direction of the comparison.
Trend
This comparison measures the indicator’s values over multiple time periods.<br>The Mann-Kendall Test for Statistical Significance is used to evaluate the trend<br>over 4 to 10 periods of measure, subject to data availability and comparability.
County/City: Fairfax City Stroke: Medicare Population
County/City: Fairfax City Stroke: Medicare Population
6.0%
(2022)
Compared to:
VA Counties
The distribution is based on data from 133 Virginia counties and county equivalents.
U.S. Counties
The distribution is based on data from 3,129 U.S. counties and county equivalents.
VA Value
(6.0%)
The regional value is compared to the Virginia State value.
US Value
(6.0%)
The regional value is compared to the national value.
Prior Value
(6.0%)
Prior Value compares a measured value with the previously measured value. Confidence intervals were not taken into account in determining the direction of the comparison.
Trend
This comparison measures the indicator’s values over multiple time periods.<br>The Mann-Kendall Test for Statistical Significance is used to evaluate the trend<br>over 4 to 10 periods of measure, subject to data availability and comparability.
County/City: Fairfax City
Health / Immunizations & Infectious Diseases
Value
Compared to:
County/City: Fairfax City Age-Adjusted Death Rate due to Influenza and Pneumonia
County/City: Fairfax City Age-Adjusted Death Rate due to Influenza and Pneumonia
20.0
Deaths per 100,000 population
(2015-2017)
Compared to:
U.S. Counties
The distribution is based on data from 1,461 U.S. counties and county equivalents.
VA Value
(13.8)
The regional value is compared to the Virginia State value.
US Value
(14.3)
The regional value is compared to the national value.
County/City: Fairfax City Age-Adjusted Hospitalization Rate due to Community Acquired Pneumonia
County/City: Fairfax City Age-Adjusted Hospitalization Rate due to Community Acquired Pneumonia
7.5
Hospitalizations per 10,000 population 18+ years
(2020-2022)
Compared to:
VA Counties
The distribution is based on data from 129 Virginia counties and county equivalents.
VA Value
(7.8)
The regional value is compared to the Virginia State value.
Prior Value
(8.6)
Prior Value compares a measured value with the previously measured value. Confidence intervals were taken into account in determining the direction of the comparison.
Trend
This comparison measures the indicator’s values over multiple time periods.<br>The Mann-Kendall Test for Statistical Significance is used to evaluate the trend<br>over 4 to 10 periods of measure, subject to data availability and comparability.
County/City: Fairfax City Age-Adjusted Hospitalization Rate due to Immunization-Preventable Pneumonia and Influenza
County/City: Fairfax City Age-Adjusted Hospitalization Rate due to Immunization-Preventable Pneumonia and Influenza
3.2
Hospitalizations per 10,000 population 18+ years
(2018-2020)
Compared to:
VA Counties
The distribution is based on data from 113 Virginia counties and county equivalents.
VA Value
(3.7)
The regional value is compared to the Virginia State value.
Prior Value
(4.1)
Prior Value compares a measured value with the previously measured value. Confidence intervals were taken into account in determining the direction of the comparison.
County/City: Fairfax City COVID-19 Daily Average Case-Fatality Rate
County/City: Fairfax City COVID-19 Daily Average Case-Fatality Rate
0.0
Deaths per 100 cases
(Mar 3, 2023)
Compared to:
VA Counties
(Feb 10, 2023)
The distribution is based on data from 131 Virginia counties and county equivalents.
U.S. Counties
(Mar 25, 2022)
The distribution is based on data from 2,811 U.S. counties and county equivalents.
VA Value
(0.4)
The regional value is compared to the Virginia State value.
US Value
(1.7)
The regional value is compared to the national value.
Prior Value
(0.0)
Prior Value compares a measured value with the previously measured value. Confidence intervals were not taken into account in determining the direction of the comparison.
Trend
This comparison measures the indicator’s values over multiple time periods.<br>The Mann-Kendall Test for Statistical Significance is used to evaluate the trend<br>over 4 to 10 periods of measure, subject to data availability and comparability.
County/City: Fairfax City COVID-19 Daily Average Incidence Rate
County/City: Fairfax City COVID-19 Daily Average Incidence Rate
7.02
Cases per 100,000 population
(Mar 3, 2023)
Compared to:
VA Counties
The distribution is based on data from 133 Virginia counties and county equivalents.
U.S. Counties
The distribution is based on data from 3,142 U.S. counties and county equivalents.
VA Value
(9.37)
The regional value is compared to the Virginia State value.
US Value
(10.97)
The regional value is compared to the national value.
Prior Value
(12.29)
Prior Value compares a measured value with the previously measured value. Confidence intervals were not taken into account in determining the direction of the comparison.
Trend
This comparison measures the indicator’s values over multiple time periods.<br>The Mann-Kendall Test for Statistical Significance is used to evaluate the trend<br>over 4 to 10 periods of measure, subject to data availability and comparability.
County/City: Fairfax City Flu Vaccinations: Medicare Population
County/City: Fairfax City Flu Vaccinations: Medicare Population
55.0%
(2022)
Compared to:
VA Counties
The distribution is based on data from 133 Virginia counties and county equivalents.
U.S. Counties
The distribution is based on data from 3,129 U.S. counties and county equivalents.
VA Value
(52.0%)
The regional value is compared to the Virginia State value.
US Value
(50.0%)
The regional value is compared to the national value.
Prior Value
(57.0%)
Prior Value compares a measured value with the previously measured value. Confidence intervals were not taken into account in determining the direction of the comparison.
Trend
This comparison measures the indicator’s values over multiple time periods.<br>The Mann-Kendall Test for Statistical Significance is used to evaluate the trend<br>over 4 to 10 periods of measure, subject to data availability and comparability.
County/City: Fairfax City Hepatitis C Incidence Rate (18-30 years)
County/City: Fairfax City Hepatitis C Incidence Rate (18-30 years)
24.0
Cases per 100,000 population
(2018)
Compared to:
VA Counties
The distribution is based on data from 133 Virginia counties and county equivalents.
VA Value
(133.1)
The regional value is compared to the Virginia State value.
Prior Value
(73.0)
Prior Value compares a measured value with the previously measured value. Confidence intervals were not taken into account in determining the direction of the comparison.
Trend
This comparison measures the indicator’s values over multiple time periods.<br>The Mann-Kendall Test for Statistical Significance is used to evaluate the trend<br>over 4 to 10 periods of measure, subject to data availability and comparability.
County/City: Fairfax City Persons Fully Vaccinated Against COVID-19
County/City: Fairfax City Persons Fully Vaccinated Against COVID-19
69.8%
(May 10, 2023)
Compared to:
VA Counties
The distribution is based on data from 133 Virginia counties and county equivalents.
U.S. Counties
The distribution is based on data from 3,125 U.S. counties and county equivalents.
Prior Value
(69.8%)
Prior Value compares a measured value with the previously measured value. Confidence intervals were not taken into account in determining the direction of the comparison.
Trend
This comparison measures the indicator’s values over multiple time periods.<br>The Mann-Kendall Test for Statistical Significance is used to evaluate the trend<br>over 4 to 10 periods of measure, subject to data availability and comparability.
County/City: Fairfax City Pneumonia Vaccinations: Medicare Population
County/City: Fairfax City Pneumonia Vaccinations: Medicare Population
8.0%
(2022)
Compared to:

VA Counties
The distribution is based on data from 133 Virginia counties and county equivalents.
U.S. Counties
The distribution is based on data from 3,129 U.S. counties and county equivalents.
VA Value
(8.0%)
The regional value is compared to the Virginia State value.
US Value
(8.0%)
The regional value is compared to the national value.
Prior Value
(6.0%)
Prior Value compares a measured value with the previously measured value. Confidence intervals were not taken into account in determining the direction of the comparison.
Trend
This comparison measures the indicator’s values over multiple time periods.<br>The Mann-Kendall Test for Statistical Significance is used to evaluate the trend<br>over 4 to 10 periods of measure, subject to data availability and comparability.
County/City: Fairfax City
Health / Maternal, Fetal & Infant Health
Value
Compared to:
County/City: Fairfax City Babies with Low Birthweight
County/City: Fairfax City Babies with Low Birthweight
4.7%
(2020)
Compared to:
VA Counties
The distribution is based on data from 133 Virginia counties and county equivalents.
VA Value
(8.3%)
The regional value is compared to the Virginia State value.
US Value
(8.2%)
The regional value is compared to the national value. The source for the national value is Centers for Disease Control and Prevention
Prior Value
(8.8%)
Prior Value compares a measured value with the previously measured value. Confidence intervals were not taken into account in determining the direction of the comparison.
Trend
This comparison measures the indicator’s values over multiple time periods.<br>The Mann-Kendall Test for Statistical Significance is used to evaluate the trend<br>over 4 to 10 periods of measure, subject to data availability and comparability.
County/City: Fairfax City Babies with Very Low Birthweight
County/City: Fairfax City Babies with Very Low Birthweight
1.0%
(2020)
Compared to:
VA Counties
The distribution is based on data from 133 Virginia counties and county equivalents.
VA Value
(1.4%)
The regional value is compared to the Virginia State value.
US Value
(1.3%)
The regional value is compared to the national value. The source for the national value is Centers for Disease Control and Prevention
Prior Value
(1.9%)
Prior Value compares a measured value with the previously measured value. Confidence intervals were not taken into account in determining the direction of the comparison.
Trend
This comparison measures the indicator’s values over multiple time periods.<br>The Mann-Kendall Test for Statistical Significance is used to evaluate the trend<br>over 4 to 10 periods of measure, subject to data availability and comparability.
County/City: Fairfax City Infant Mortality Rate
County/City: Fairfax City Infant Mortality Rate
0.0
Deaths per 1,000 live births
(2020)
Compared to:
VA Counties
The distribution is based on data from 133 Virginia counties and county equivalents.
VA Value
(5.3)
The regional value is compared to the Virginia State value.
US Value
(5.4)
The regional value is compared to the national value. The source for the national value is Centers for Disease Control and Prevention
Prior Value
(8.0)
Prior Value compares a measured value with the previously measured value. Confidence intervals were not taken into account in determining the direction of the comparison.
Trend
This comparison measures the indicator’s values over multiple time periods.<br>The Mann-Kendall Test for Statistical Significance is used to evaluate the trend<br>over 4 to 10 periods of measure, subject to data availability and comparability.
HP 2030 Target
(5.0)
<div>MICH-02: Reduce the rate of infant deaths <strong>(LEADING HEALTH INDICATOR)</strong></div>
County/City: Fairfax City
Health / Mental Health & Mental Disorders
Value
Compared to:
County/City: Fairfax City Adults Ever Diagnosed with Depression
County/City: Fairfax City Adults Ever Diagnosed with Depression
18.5%
(2021)
Compared to:
VA Counties
The distribution is based on data from 133 Virginia counties and county equivalents.
U.S. Counties
The distribution is based on data from 3,074 U.S. counties and county equivalents.
US Value
(19.5%)
The regional value is compared to the national value.
County/City: Fairfax City Age-Adjusted Death Rate due to Suicide
County/City: Fairfax City Age-Adjusted Death Rate due to Suicide
31.7
Deaths per 100,000 population
(2018-2020)
Compared to:
U.S. Counties
The distribution is based on data from 1,307 U.S. counties and county equivalents.
VA Value
(13.4)
The regional value is compared to the Virginia State value.
US Value
(13.9)
The regional value is compared to the national value.
HP 2030 Target
(12.8)
<div>MHMD-01: Reduce the suicide rate <strong>(LEADING HEALTH INDICATOR)</strong></div>
County/City: Fairfax City Depression: Medicare Population
County/City: Fairfax City Depression: Medicare Population
13.0%
(2022)
Compared to:
VA Counties
The distribution is based on data from 133 Virginia counties and county equivalents.
U.S. Counties
The distribution is based on data from 3,129 U.S. counties and county equivalents.
VA Value
(16.0%)
The regional value is compared to the Virginia State value.
US Value
(16.0%)
The regional value is compared to the national value.
Prior Value
(13.0%)
Prior Value compares a measured value with the previously measured value. Confidence intervals were not taken into account in determining the direction of the comparison.
Trend
This comparison measures the indicator’s values over multiple time periods.<br>The Mann-Kendall Test for Statistical Significance is used to evaluate the trend<br>over 4 to 10 periods of measure, subject to data availability and comparability.
County/City: Fairfax City Mental Health Provider Rate
County/City: Fairfax City Mental Health Provider Rate
1,866
Providers per 100,000 population
(2022)
Compared to:
VA Counties
The distribution is based on data from 129 Virginia counties and county equivalents.
U.S. Counties
The distribution is based on data from 2,941 U.S. counties and county equivalents.
VA Value
(224)
The regional value is compared to the Virginia State value.
Prior Value
(1,669)
Prior Value compares a measured value with the previously measured value. Confidence intervals were not taken into account in determining the direction of the comparison.
Trend
This comparison measures the indicator’s values over multiple time periods.<br>The Mann-Kendall Test for Statistical Significance is used to evaluate the trend<br>over 4 to 10 periods of measure, subject to data availability and comparability.
County/City: Fairfax City Poor Mental Health: 14+ Days
County/City: Fairfax City Poor Mental Health: 14+ Days
12.9%
(2021)
Compared to:
VA Counties
The distribution is based on data from 133 Virginia counties and county equivalents.
U.S. Counties
The distribution is based on data from 3,074 U.S. counties and county equivalents.
US Value
(14.7%)
The regional value is compared to the national value.
County/City: Fairfax City
Health / Mortality Data
Value
Compared to:
County/City: Fairfax City Life Expectancy
County/City: Fairfax City Life Expectancy
76.9
Years
(2018-2020)
Compared to:
VA Counties
The distribution is based on data from 133 Virginia counties and county equivalents.
U.S. Counties
The distribution is based on data from 3,072 U.S. counties and county equivalents.
VA Value
(79.1)
The regional value is compared to the Virginia State value.
US Value
(78.5)
The regional value is compared to the national value.
Prior Value
(77.4)
Prior Value compares a measured value with the previously measured value. Confidence intervals were taken into account in determining the direction of the comparison.
Trend
This comparison measures the indicator’s values over multiple time periods.<br>The Mann-Kendall Test for Statistical Significance is used to evaluate the trend<br>over 4 to 10 periods of measure, subject to data availability and comparability.
County/City: Fairfax City Premature Death
County/City: Fairfax City Premature Death
7,682.6
Years per 100,000 population
(2018-2020)
Compared to:
VA Counties
The distribution is based on data from 129 Virginia counties and county equivalents.
U.S. Counties
The distribution is based on data from 2,865 U.S. counties and county equivalents.
VA Value
(6,706.7)
The regional value is compared to the Virginia State value.
US Value
(7,300.0)
The regional value is compared to the national value.
Prior Value
(6,955.8)
Prior Value compares a measured value with the previously measured value. Confidence intervals were taken into account in determining the direction of the comparison.
Trend
This comparison measures the indicator’s values over multiple time periods.<br>The Mann-Kendall Test for Statistical Significance is used to evaluate the trend<br>over 4 to 10 periods of measure, subject to data availability and comparability.
County/City: Fairfax City
Health / Older Adults
Value
Compared to:
County/City: Fairfax City Adults 65+ who Received Recommended Preventive Services: Females
County/City: Fairfax City Adults 65+ who Received Recommended Preventive Services: Females
47.3%
(2020)
Compared to:
VA Counties
The distribution is based on data from 133 Virginia counties and county equivalents.
U.S. Counties
The distribution is based on data from 3,141 U.S. counties and county equivalents.
US Value
(37.9%)
The regional value is compared to the national value.
County/City: Fairfax City Adults 65+ who Received Recommended Preventive Services: Males
County/City: Fairfax City Adults 65+ who Received Recommended Preventive Services: Males
52.3%
(2020)
Compared to:
VA Counties
The distribution is based on data from 133 Virginia counties and county equivalents.
U.S. Counties
The distribution is based on data from 3,141 U.S. counties and county equivalents.
US Value
(43.7%)
The regional value is compared to the national value.
County/City: Fairfax City Adults 65+ with a Disability
County/City: Fairfax City Adults 65+ with a Disability
21.5%
(2018-2022)
Compared to:

VA Value
(31.9%)
The regional value is compared to the Virginia State value.
US Value
(33.3%)
The regional value is compared to the national value.
Trend
This comparison measures the indicator’s values over multiple time periods.<br>The Mann-Kendall Test for Statistical Significance is used to evaluate the trend<br>over 4 to 10 periods of measure, subject to data availability and comparability.
County/City: Fairfax City Adults 65+ with a Hearing Difficulty
County/City: Fairfax City Adults 65+ with a Hearing Difficulty
10.0%
(2018-2022)
Compared to:
VA Value
(13.0%)
The regional value is compared to the Virginia State value.
US Value
(13.7%)
The regional value is compared to the national value.
Trend
This comparison measures the indicator’s values over multiple time periods.<br>The Mann-Kendall Test for Statistical Significance is used to evaluate the trend<br>over 4 to 10 periods of measure, subject to data availability and comparability.
County/City: Fairfax City Adults 65+ with a Self-Care Difficulty
County/City: Fairfax City Adults 65+ with a Self-Care Difficulty
4.7%
(2018-2022)
Compared to:
VA Value
(7.1%)
The regional value is compared to the Virginia State value.
US Value
(7.4%)
The regional value is compared to the national value.
Trend
This comparison measures the indicator’s values over multiple time periods.<br>The Mann-Kendall Test for Statistical Significance is used to evaluate the trend<br>over 4 to 10 periods of measure, subject to data availability and comparability.
County/City: Fairfax City Adults 65+ with a Vision Difficulty
County/City: Fairfax City Adults 65+ with a Vision Difficulty
2.8%
(2018-2022)
Compared to:
VA Value
(5.9%)
The regional value is compared to the Virginia State value.
US Value
(6.0%)
The regional value is compared to the national value.
Trend
This comparison measures the indicator’s values over multiple time periods.<br>The Mann-Kendall Test for Statistical Significance is used to evaluate the trend<br>over 4 to 10 periods of measure, subject to data availability and comparability.
County/City: Fairfax City Adults 65+ with an Independent Living Difficulty
County/City: Fairfax City Adults 65+ with an Independent Living Difficulty
7.0%
(2018-2022)
Compared to:
VA Value
(13.1%)
The regional value is compared to the Virginia State value.
US Value
(13.6%)
The regional value is compared to the national value.
Trend
This comparison measures the indicator’s values over multiple time periods.<br>The Mann-Kendall Test for Statistical Significance is used to evaluate the trend<br>over 4 to 10 periods of measure, subject to data availability and comparability.
County/City: Fairfax City Age-Adjusted Death Rate due to Alzheimer's Disease
County/City: Fairfax City Age-Adjusted Death Rate due to Alzheimer's Disease
23.4
Deaths per 100,000 population
(2018-2020)
Compared to:
VA Counties
The distribution is based on data from 100 Virginia counties and county equivalents.
U.S. Counties
The distribution is based on data from 2,140 U.S. counties and county equivalents.
VA Value
(27.6)
The regional value is compared to the Virginia State value.
US Value
(31.0)
The regional value is compared to the national value.
Prior Value
(24.4)
Prior Value compares a measured value with the previously measured value. Confidence intervals were taken into account in determining the direction of the comparison.
Trend
This comparison measures the indicator’s values over multiple time periods.<br>The Mann-Kendall Test for Statistical Significance is used to evaluate the trend<br>over 4 to 10 periods of measure, subject to data availability and comparability.
County/City: Fairfax City Alzheimer's Disease or Dementia: Medicare Population
County/City: Fairfax City Alzheimer's Disease or Dementia: Medicare Population
7.0%
(2022)
Compared to:
VA Counties
The distribution is based on data from 133 Virginia counties and county equivalents.
U.S. Counties
The distribution is based on data from 3,129 U.S. counties and county equivalents.
VA Value
(6.0%)
The regional value is compared to the Virginia State value.
US Value
(6.0%)
The regional value is compared to the national value.
Prior Value
(7.0%)
Prior Value compares a measured value with the previously measured value. Confidence intervals were not taken into account in determining the direction of the comparison.
Trend
This comparison measures the indicator’s values over multiple time periods.<br>The Mann-Kendall Test for Statistical Significance is used to evaluate the trend<br>over 4 to 10 periods of measure, subject to data availability and comparability.
County/City: Fairfax City Hospitalization Rate due to Hip Fractures Among Females 65+
County/City: Fairfax City Hospitalization Rate due to Hip Fractures Among Females 65+
314.0
Hospitalizations per 100,000 females 65+ years
(2020-2022)
Compared to:
VA Counties
The distribution is based on data from 116 Virginia counties and county equivalents.
VA Value
(451.9)
The regional value is compared to the Virginia State value.
Prior Value
(291.9)
Prior Value compares a measured value with the previously measured value. Confidence intervals were taken into account in determining the direction of the comparison.
Trend
This comparison measures the indicator’s values over multiple time periods.<br>The Mann-Kendall Test for Statistical Significance is used to evaluate the trend<br>over 4 to 10 periods of measure, subject to data availability and comparability.
County/City: Fairfax City Hospitalization Rate due to Hip Fractures Among Males 65+
County/City: Fairfax City Hospitalization Rate due to Hip Fractures Among Males 65+
188.9
Hospitalizations per 100,000 males 65+ years
(2020-2022)
Compared to:
VA Counties
The distribution is based on data from 89 Virginia counties and county equivalents.
VA Value
(246.4)
The regional value is compared to the Virginia State value.
Prior Value
(118.6)
Prior Value compares a measured value with the previously measured value. Confidence intervals were taken into account in determining the direction of the comparison.
Trend
This comparison measures the indicator’s values over multiple time periods.<br>The Mann-Kendall Test for Statistical Significance is used to evaluate the trend<br>over 4 to 10 periods of measure, subject to data availability and comparability.
County/City: Fairfax City
Health / Oral Health
Value
Compared to:
County/City: Fairfax City Adults 65+ with Total Tooth Loss
County/City: Fairfax City Adults 65+ with Total Tooth Loss
5.8%
(2020)
Compared to:
VA Counties
The distribution is based on data from 133 Virginia counties and county equivalents.
U.S. Counties
The distribution is based on data from 3,141 U.S. counties and county equivalents.
US Value
(13.4%)
The regional value is compared to the national value.
County/City: Fairfax City Adults who Visited a Dentist
County/City: Fairfax City Adults who Visited a Dentist
73.5%
(2020)
Compared to:
VA Counties
The distribution is based on data from 133 Virginia counties and county equivalents.
U.S. Counties
The distribution is based on data from 3,141 U.S. counties and county equivalents.
US Value
(64.8%)
The regional value is compared to the national value.
County/City: Fairfax City
Health / Other Conditions
Value
Compared to:
County/City: Fairfax City Adults with Arthritis
County/City: Fairfax City Adults with Arthritis
22.4%
(2021)
Compared to:
VA Counties
The distribution is based on data from 133 Virginia counties and county equivalents.
U.S. Counties
The distribution is based on data from 3,074 U.S. counties and county equivalents.
US Value
(25.2%)
The regional value is compared to the national value.
County/City: Fairfax City Adults with Kidney Disease
County/City: Fairfax City Adults with Kidney Disease
2.7%
(2021)
Compared to:
VA Counties
The distribution is based on data from 133 Virginia counties and county equivalents.
U.S. Counties
The distribution is based on data from 3,074 U.S. counties and county equivalents.
US Value
(3.1%)
The regional value is compared to the national value.
County/City: Fairfax City Age-Adjusted Hospitalization Rate due to Dehydration
County/City: Fairfax City Age-Adjusted Hospitalization Rate due to Dehydration
8.0
Hospitalizations per 10,000 population 18+ years
(2020-2022)
Compared to:
VA Counties
The distribution is based on data from 126 Virginia counties and county equivalents.
VA Value
(9.5)
The regional value is compared to the Virginia State value.
Prior Value
(9.1)
Prior Value compares a measured value with the previously measured value. Confidence intervals were taken into account in determining the direction of the comparison.
Trend
This comparison measures the indicator’s values over multiple time periods.<br>The Mann-Kendall Test for Statistical Significance is used to evaluate the trend<br>over 4 to 10 periods of measure, subject to data availability and comparability.
County/City: Fairfax City Age-Adjusted Hospitalization Rate due to Urinary Tract Infections
County/City: Fairfax City Age-Adjusted Hospitalization Rate due to Urinary Tract Infections
9.4
Hospitalizations per 10,000 population 18+ years
(2020-2022)
Compared to:
VA Counties
The distribution is based on data from 127 Virginia counties and county equivalents.
VA Value
(7.3)
The regional value is compared to the Virginia State value.
Prior Value
(12.4)
Prior Value compares a measured value with the previously measured value. Confidence intervals were taken into account in determining the direction of the comparison.
Trend
This comparison measures the indicator’s values over multiple time periods.<br>The Mann-Kendall Test for Statistical Significance is used to evaluate the trend<br>over 4 to 10 periods of measure, subject to data availability and comparability.
County/City: Fairfax City Chronic Kidney Disease: Medicare Population
County/City: Fairfax City Chronic Kidney Disease: Medicare Population
14.0%
(2022)
Compared to:
VA Counties
The distribution is based on data from 133 Virginia counties and county equivalents.
U.S. Counties
The distribution is based on data from 3,129 U.S. counties and county equivalents.
VA Value
(17.0%)
The regional value is compared to the Virginia State value.
US Value
(18.0%)
The regional value is compared to the national value.
Prior Value
(13.0%)
Prior Value compares a measured value with the previously measured value. Confidence intervals were not taken into account in determining the direction of the comparison.
Trend
This comparison measures the indicator’s values over multiple time periods.<br>The Mann-Kendall Test for Statistical Significance is used to evaluate the trend<br>over 4 to 10 periods of measure, subject to data availability and comparability.
County/City: Fairfax City Osteoporosis: Medicare Population
County/City: Fairfax City Osteoporosis: Medicare Population
12.0%
(2022)
Compared to:
VA Counties
The distribution is based on data from 133 Virginia counties and county equivalents.
U.S. Counties
The distribution is based on data from 3,129 U.S. counties and county equivalents.
VA Value
(11.0%)
The regional value is compared to the Virginia State value.
US Value
(11.0%)
The regional value is compared to the national value.
Prior Value
(11.0%)
Prior Value compares a measured value with the previously measured value. Confidence intervals were not taken into account in determining the direction of the comparison.
Trend
This comparison measures the indicator’s values over multiple time periods.<br>The Mann-Kendall Test for Statistical Significance is used to evaluate the trend<br>over 4 to 10 periods of measure, subject to data availability and comparability.
County/City: Fairfax City Rheumatoid Arthritis or Osteoarthritis: Medicare Population
County/City: Fairfax City Rheumatoid Arthritis or Osteoarthritis: Medicare Population
33.0%
(2022)
Compared to:
VA Counties
The distribution is based on data from 133 Virginia counties and county equivalents.
U.S. Counties
The distribution is based on data from 3,129 U.S. counties and county equivalents.
VA Value
(35.0%)
The regional value is compared to the Virginia State value.
US Value
(35.0%)
The regional value is compared to the national value.
Prior Value
(31.0%)
Prior Value compares a measured value with the previously measured value. Confidence intervals were not taken into account in determining the direction of the comparison.
Trend
This comparison measures the indicator’s values over multiple time periods.<br>The Mann-Kendall Test for Statistical Significance is used to evaluate the trend<br>over 4 to 10 periods of measure, subject to data availability and comparability.
County/City: Fairfax City
Health / Physical Activity
Value
Compared to:
County/City: Fairfax City Adults 20+ who are Sedentary
County/City: Fairfax City Adults 20+ who are Sedentary
12.7%
(2021)
Compared to:
VA Counties
The distribution is based on data from 133 Virginia counties and county equivalents.
U.S. Counties
The distribution is based on data from 3,074 U.S. counties and county equivalents.
Prior Value
(15.6%)
Prior Value compares a measured value with the previously measured value. Confidence intervals were taken into account in determining the direction of the comparison.
Trend
This comparison measures the indicator’s values over multiple time periods.<br>The Mann-Kendall Test for Statistical Significance is used to evaluate the trend<br>over 4 to 10 periods of measure, subject to data availability and comparability.
County/City: Fairfax City
Health / Prevention & Safety
Value
Compared to:
County/City: Fairfax City Age-Adjusted Death Rate due to Unintentional Injuries
County/City: Fairfax City Age-Adjusted Death Rate due to Unintentional Injuries
49.3
Deaths per 100,000 population
(2018-2020)
Compared to:
VA Counties
The distribution is based on data from 111 Virginia counties and county equivalents.
U.S. Counties
The distribution is based on data from 2,454 U.S. counties and county equivalents.
VA Value
(46.7)
The regional value is compared to the Virginia State value.
US Value
(51.6)
The regional value is compared to the national value.
Prior Value
(52.2)
Prior Value compares a measured value with the previously measured value. Confidence intervals were taken into account in determining the direction of the comparison.
Trend
This comparison measures the indicator’s values over multiple time periods.<br>The Mann-Kendall Test for Statistical Significance is used to evaluate the trend<br>over 4 to 10 periods of measure, subject to data availability and comparability.
HP 2030 Target
(43.2)
County/City: Fairfax City Age-Adjusted Hospitalization Rate due to Unintentional Falls
County/City: Fairfax City Age-Adjusted Hospitalization Rate due to Unintentional Falls
53.4
Hospitalizations per 10,000 population 18+ years
(2020-2022)
Compared to:
VA Counties
The distribution is based on data from 130 Virginia counties and county equivalents.
VA Value
(38.7)
The regional value is compared to the Virginia State value.
Prior Value
(52.4)
Prior Value compares a measured value with the previously measured value. Confidence intervals were taken into account in determining the direction of the comparison.
Trend
This comparison measures the indicator’s values over multiple time periods.<br>The Mann-Kendall Test for Statistical Significance is used to evaluate the trend<br>over 4 to 10 periods of measure, subject to data availability and comparability.
County/City: Fairfax City
Health / Respiratory Diseases
Value
Compared to:
County/City: Fairfax City Adults with COPD
County/City: Fairfax City Adults with COPD
4.7%
Percent of adults
(2021)
Compared to:
VA Counties
The distribution is based on data from 133 Virginia counties and county equivalents.
U.S. Counties
The distribution is based on data from 3,074 U.S. counties and county equivalents.
US Value
(6.4%)
The regional value is compared to the national value.
County/City: Fairfax City Adults with Current Asthma
County/City: Fairfax City Adults with Current Asthma
9.0%
(2021)
Compared to:
VA Counties
The distribution is based on data from 133 Virginia counties and county equivalents.
U.S. Counties
The distribution is based on data from 3,074 U.S. counties and county equivalents.
US Value
(9.7%)
The regional value is compared to the national value.
County/City: Fairfax City Age-Adjusted Hospitalization Rate due to Adult Asthma
County/City: Fairfax City Age-Adjusted Hospitalization Rate due to Adult Asthma
2.1
Hospitalizations per 10,000 population 18+ years
(2019-2021)
Compared to:
VA Counties
The distribution is based on data from 78 Virginia counties and county equivalents.
VA Value
(2.5)
The regional value is compared to the Virginia State value.
Prior Value
(3.5)
Prior Value compares a measured value with the previously measured value. Confidence intervals were taken into account in determining the direction of the comparison.
Trend
This comparison measures the indicator’s values over multiple time periods.<br>The Mann-Kendall Test for Statistical Significance is used to evaluate the trend<br>over 4 to 10 periods of measure, subject to data availability and comparability.
County/City: Fairfax City Age-Adjusted Hospitalization Rate due to Asthma
County/City: Fairfax City Age-Adjusted Hospitalization Rate due to Asthma
1.7
Hospitalizations per 10,000 population
(2019-2021)
Compared to:
VA Counties
The distribution is based on data from 98 Virginia counties and county equivalents.
VA Value
(2.6)
The regional value is compared to the Virginia State value.
Prior Value
(3.2)
Prior Value compares a measured value with the previously measured value. Confidence intervals were taken into account in determining the direction of the comparison.
Trend
This comparison measures the indicator’s values over multiple time periods.<br>The Mann-Kendall Test for Statistical Significance is used to evaluate the trend<br>over 4 to 10 periods of measure, subject to data availability and comparability.
County/City: Fairfax City Age-Adjusted Hospitalization Rate due to COPD
County/City: Fairfax City Age-Adjusted Hospitalization Rate due to COPD
4.3
Hospitalizations per 10,000 population 18+ years
(2020-2022)
Compared to:
VA Counties
The distribution is based on data from 127 Virginia counties and county equivalents.
VA Value
(8.3)
The regional value is compared to the Virginia State value.
Prior Value
(6.1)
Prior Value compares a measured value with the previously measured value. Confidence intervals were taken into account in determining the direction of the comparison.
Trend
This comparison measures the indicator’s values over multiple time periods.<br>The Mann-Kendall Test for Statistical Significance is used to evaluate the trend<br>over 4 to 10 periods of measure, subject to data availability and comparability.
County/City: Fairfax City Age-Adjusted Hospitalization Rate due to Pediatric Asthma
County/City: Fairfax City Age-Adjusted Hospitalization Rate due to Pediatric Asthma
7.9
Hospitalizations per 10,000 population under 18 years
(2014-2016)
Compared to:
VA Value
(6.6)
The regional value is compared to the Virginia State value.
County/City: Fairfax City Asthma: Medicare Population
County/City: Fairfax City Asthma: Medicare Population
7.0%
(2022)
Compared to:
VA Counties
The distribution is based on data from 133 Virginia counties and county equivalents.
U.S. Counties
The distribution is based on data from 3,129 U.S. counties and county equivalents.
VA Value
(7.0%)
The regional value is compared to the Virginia State value.
US Value
(7.0%)
The regional value is compared to the national value.
Prior Value
(7.0%)
Prior Value compares a measured value with the previously measured value. Confidence intervals were not taken into account in determining the direction of the comparison.
Trend
This comparison measures the indicator’s values over multiple time periods.<br>The Mann-Kendall Test for Statistical Significance is used to evaluate the trend<br>over 4 to 10 periods of measure, subject to data availability and comparability.
County/City: Fairfax City COPD: Medicare Population
County/City: Fairfax City COPD: Medicare Population
7.0%
(2022)
Compared to:
VA Counties
The distribution is based on data from 133 Virginia counties and county equivalents.
U.S. Counties
The distribution is based on data from 3,129 U.S. counties and county equivalents.
VA Value
(10.0%)
The regional value is compared to the Virginia State value.
US Value
(11.0%)
The regional value is compared to the national value.
Prior Value
(7.0%)
Prior Value compares a measured value with the previously measured value. Confidence intervals were not taken into account in determining the direction of the comparison.
Trend
This comparison measures the indicator’s values over multiple time periods.<br>The Mann-Kendall Test for Statistical Significance is used to evaluate the trend<br>over 4 to 10 periods of measure, subject to data availability and comparability.
County/City: Fairfax City
Health / Sexually Transmitted Infections
Value
Compared to:
County/City: Fairfax City Chlamydia Incidence Rate
County/City: Fairfax City Chlamydia Incidence Rate
238.9
Cases per 100,000 population
(2022)
Compared to:
VA Counties
The distribution is based on data from 132 Virginia counties and county equivalents.
VA Value
(473.0)
The regional value is compared to the Virginia State value.
US Value
(495.5 in 2021)
The regional value is compared to the national value. The source for the national value is National Center for HIV/AIDS, Viral Hepatitis, STD, and TB Prevention
Prior Value
(328.7)
Prior Value compares a measured value with the previously measured value. Confidence intervals were not taken into account in determining the direction of the comparison.
Trend
This comparison measures the indicator’s values over multiple time periods.<br>The Mann-Kendall Test for Statistical Significance is used to evaluate the trend<br>over 4 to 10 periods of measure, subject to data availability and comparability.
County/City: Fairfax City Gonorrhea Incidence Rate
County/City: Fairfax City Gonorrhea Incidence Rate
49.4
Cases per 100,000 population
(2022)
Compared to:
VA Counties
The distribution is based on data from 132 Virginia counties and county equivalents.
VA Value
(155.7)
The regional value is compared to the Virginia State value.
US Value
(214.0 in 2021)
The regional value is compared to the national value. The source for the national value is National Center for HIV/AIDS, Viral Hepatitis, STD, and TB Prevention
Prior Value
(76.8)
Prior Value compares a measured value with the previously measured value. Confidence intervals were not taken into account in determining the direction of the comparison.
Trend
This comparison measures the indicator’s values over multiple time periods.<br>The Mann-Kendall Test for Statistical Significance is used to evaluate the trend<br>over 4 to 10 periods of measure, subject to data availability and comparability.
County/City: Fairfax City HIV Diagnosis Rate
County/City: Fairfax City HIV Diagnosis Rate
0.0
Cases per 100,000 population
(2015)
Compared to:
VA Value
(11.6)
The regional value is compared to the Virginia State value.
Prior Value
(0.0)
Prior Value compares a measured value with the previously measured value. Confidence intervals were not taken into account in determining the direction of the comparison.
County/City: Fairfax City HIV/AIDS Prevalence Rate
County/City: Fairfax City HIV/AIDS Prevalence Rate
296.6
Cases per 100,000 population
(2022)
Compared to:

VA Value
(312.1)
The regional value is compared to the Virginia State value.
Prior Value
(293.0)
Prior Value compares a measured value with the previously measured value. Confidence intervals were not taken into account in determining the direction of the comparison.
Trend
This comparison measures the indicator’s values over multiple time periods.<br>The Mann-Kendall Test for Statistical Significance is used to evaluate the trend<br>over 4 to 10 periods of measure, subject to data availability and comparability.
County/City: Fairfax City
Health / Tobacco Use
Value
Compared to:
County/City: Fairfax City Adults who Smoke
County/City: Fairfax City Adults who Smoke
10.1%
(2021)
Compared to:
VA Counties
The distribution is based on data from 133 Virginia counties and county equivalents.
U.S. Counties
The distribution is based on data from 3,074 U.S. counties and county equivalents.
US Value
(13.5%)
The regional value is compared to the national value.
HP 2030 Target
(6.1%)
<div>TU-02: Reduce current cigarette smoking in adults <strong>(LEADING HEALTH INDICATOR)</strong></div>
County/City: Fairfax City
Health / Weight Status
Value
Compared to:
County/City: Fairfax City Adults 20+ Who Are Obese
County/City: Fairfax City Adults 20+ Who Are Obese
22.3%
(2021)
Compared to:
VA Counties
The distribution is based on data from 133 Virginia counties and county equivalents.
U.S. Counties
The distribution is based on data from 3,074 U.S. counties and county equivalents.
Prior Value
(23.7%)
Prior Value compares a measured value with the previously measured value. Confidence intervals were taken into account in determining the direction of the comparison.
Trend
This comparison measures the indicator’s values over multiple time periods.<br>The Mann-Kendall Test for Statistical Significance is used to evaluate the trend<br>over 4 to 10 periods of measure, subject to data availability and comparability.
HP 2030 Target
(36.0%)
County/City: Fairfax City
Health / Wellness & Lifestyle
Value
Compared to:
County/City: Fairfax City Insufficient Sleep
County/City: Fairfax City Insufficient Sleep
31.7%
(2020)
Compared to:
VA Counties
The distribution is based on data from 133 Virginia counties and county equivalents.
U.S. Counties
The distribution is based on data from 3,140 U.S. counties and county equivalents.
VA Value
(34.5%)
The regional value is compared to the Virginia State value.
US Value
(33.0%)
The regional value is compared to the national value.
Prior Value
(34.7%)
Prior Value compares a measured value with the previously measured value. Confidence intervals were not taken into account in determining the direction of the comparison.
HP 2030 Target
(26.7%)
County/City: Fairfax City Poor Physical Health: 14+ Days
County/City: Fairfax City Poor Physical Health: 14+ Days
8.6%
(2021)
Compared to:
VA Counties
The distribution is based on data from 133 Virginia counties and county equivalents.
U.S. Counties
The distribution is based on data from 3,074 U.S. counties and county equivalents.
US Value
(10.9%)
The regional value is compared to the national value.
County/City: Fairfax City Self-Reported General Health Assessment: Poor or Fair
County/City: Fairfax City Self-Reported General Health Assessment: Poor or Fair
12.4%
(2021)
Compared to:
VA Counties
The distribution is based on data from 133 Virginia counties and county equivalents.
U.S. Counties
The distribution is based on data from 3,074 U.S. counties and county equivalents.
US Value
(16.1%)
The regional value is compared to the national value.
County/City: Fairfax City
Community / Civic Engagement
Value
Compared to:
County/City: Fairfax City Voter Turnout: Presidential Election
County/City: Fairfax City Voter Turnout: Presidential Election
78.0%
(2020)
Compared to:
VA Counties
The distribution is based on data from 133 Virginia counties and county equivalents.
VA Value
(73.9%)
The regional value is compared to the Virginia State value.
Prior Value
(91.9%)
Prior Value compares a measured value with the previously measured value. Confidence intervals were not taken into account in determining the direction of the comparison.
Trend
This comparison measures the indicator’s values over multiple time periods.<br>The Mann-Kendall Test for Statistical Significance is used to evaluate the trend<br>over 4 to 10 periods of measure, subject to data availability and comparability.
HP 2030 Target
(58.4%)
<div>SDOH-07: Increase the proportion of the voting-age citizens who vote</div>
County/City: Fairfax City
Community / Crime & Crime Prevention
Value
Compared to:
County/City: Fairfax City Violent Crime Rate
County/City: Fairfax City Violent Crime Rate
84.5
Crimes per 100,000 population
(2014-2016)
Compared to:
VA Counties
The distribution is based on data from 133 Virginia counties and county equivalents.
VA Value
(207.0)
The regional value is compared to the Virginia State value.
US Value
(386.5)
The regional value is compared to the national value.
Prior Value
(91.6)
Prior Value compares a measured value with the previously measured value. Confidence intervals were not taken into account in determining the direction of the comparison.
Trend
This comparison measures the indicator’s values over multiple time periods.<br>The Mann-Kendall Test for Statistical Significance is used to evaluate the trend<br>over 4 to 10 periods of measure, subject to data availability and comparability.
County/City: Fairfax City
Community / Demographics
Value
Compared to:
County/City: Fairfax City Average Household Size
County/City: Fairfax City Average Household Size
2.60
Persons per household
(2018-2022)
Compared to:
VA Value
(2.60)
The regional value is compared to the Virginia State value.
US Value
(2.60)
The regional value is compared to the national value.
Trend
This comparison measures the indicator’s values over multiple time periods.<br>The Mann-Kendall Test for Statistical Significance is used to evaluate the trend<br>over 4 to 10 periods of measure, subject to data availability and comparability.
County/City: Fairfax City Female Population
County/City: Fairfax City Female Population
50.7%
(2022)
Compared to:

VA Value
(50.5%)
The regional value is compared to the Virginia State value.
US Value
(50.4%)
The regional value is compared to the national value.
Prior Value
(50.5%)
Prior Value compares a measured value with the previously measured value. Confidence intervals were not taken into account in determining the direction of the comparison.
Trend
This comparison measures the indicator’s values over multiple time periods.<br>The Mann-Kendall Test for Statistical Significance is used to evaluate the trend<br>over 4 to 10 periods of measure, subject to data availability and comparability.
County/City: Fairfax City Foreign Born Persons
County/City: Fairfax City Foreign Born Persons
29.6%
(2018-2022)
Compared to:
VA Value
(12.6%)
The regional value is compared to the Virginia State value.
US Value
(13.7%)
The regional value is compared to the national value.
Trend
This comparison measures the indicator’s values over multiple time periods.<br>The Mann-Kendall Test for Statistical Significance is used to evaluate the trend<br>over 4 to 10 periods of measure, subject to data availability and comparability.
County/City: Fairfax City Households
County/City: Fairfax City Households
9,129
Households
(2018-2022)
Compared to:
Trend
This comparison measures the indicator’s values over multiple time periods.<br>The Mann-Kendall Test for Statistical Significance is used to evaluate the trend<br>over 4 to 10 periods of measure, subject to data availability and comparability.
County/City: Fairfax City Male Population
County/City: Fairfax City Male Population
49.3%
(2022)
Compared to:
VA Value
(49.5%)
The regional value is compared to the Virginia State value.
US Value
(49.6%)
The regional value is compared to the national value.
Prior Value
(49.5%)
Prior Value compares a measured value with the previously measured value. Confidence intervals were not taken into account in determining the direction of the comparison.
Trend
This comparison measures the indicator’s values over multiple time periods.<br>The Mann-Kendall Test for Statistical Significance is used to evaluate the trend<br>over 4 to 10 periods of measure, subject to data availability and comparability.
County/City: Fairfax City Population Age 5+ with Language Other than English Spoken at Home
County/City: Fairfax City Population Age 5+ with Language Other than English Spoken at Home
36.1%
(2018-2022)
Compared to:
VA Value
(16.7%)
The regional value is compared to the Virginia State value.
US Value
(21.7%)
The regional value is compared to the national value.
County/City: Fairfax City Population American Indian and Alaska Native
County/City: Fairfax City Population American Indian and Alaska Native
0.8%
(2022)
Compared to:
VA Value
(0.6%)
The regional value is compared to the Virginia State value.
US Value
(1.3%)
The regional value is compared to the national value.
Prior Value
(0.8%)
Prior Value compares a measured value with the previously measured value. Confidence intervals were not taken into account in determining the direction of the comparison.
Trend
This comparison measures the indicator’s values over multiple time periods.<br>The Mann-Kendall Test for Statistical Significance is used to evaluate the trend<br>over 4 to 10 periods of measure, subject to data availability and comparability.
County/City: Fairfax City Population Asian
County/City: Fairfax City Population Asian
20.1%
(2022)
Compared to:
VA Value
(7.3%)
The regional value is compared to the Virginia State value.
US Value
(6.3%)
The regional value is compared to the national value.
Prior Value
(19.8%)
Prior Value compares a measured value with the previously measured value. Confidence intervals were not taken into account in determining the direction of the comparison.
Trend
This comparison measures the indicator’s values over multiple time periods.<br>The Mann-Kendall Test for Statistical Significance is used to evaluate the trend<br>over 4 to 10 periods of measure, subject to data availability and comparability.
County/City: Fairfax City Population Black or African American
County/City: Fairfax City Population Black or African American
6.6%
(2022)
Compared to:
VA Value
(20.0%)
The regional value is compared to the Virginia State value.
US Value
(13.6%)
The regional value is compared to the national value.
Prior Value
(6.5%)
Prior Value compares a measured value with the previously measured value. Confidence intervals were not taken into account in determining the direction of the comparison.
Trend
This comparison measures the indicator’s values over multiple time periods.<br>The Mann-Kendall Test for Statistical Significance is used to evaluate the trend<br>over 4 to 10 periods of measure, subject to data availability and comparability.
County/City: Fairfax City Population Hispanic or Latino
County/City: Fairfax City Population Hispanic or Latino
18.8%
(2022)
Compared to:
VA Value
(10.5%)
The regional value is compared to the Virginia State value.
US Value
(19.1%)
The regional value is compared to the national value.
Prior Value
(18.5%)
Prior Value compares a measured value with the previously measured value. Confidence intervals were not taken into account in determining the direction of the comparison.
Trend
This comparison measures the indicator’s values over multiple time periods.<br>The Mann-Kendall Test for Statistical Significance is used to evaluate the trend<br>over 4 to 10 periods of measure, subject to data availability and comparability.
County/City: Fairfax City Population Native Hawaiian and Other Pacific Islander
County/City: Fairfax City Population Native Hawaiian and Other Pacific Islander
0.2%
(2022)
Compared to:
VA Value
(0.1%)
The regional value is compared to the Virginia State value.
US Value
(0.3%)
The regional value is compared to the national value.
Prior Value
(0.2%)
Prior Value compares a measured value with the previously measured value. Confidence intervals were not taken into account in determining the direction of the comparison.
Trend
This comparison measures the indicator’s values over multiple time periods.<br>The Mann-Kendall Test for Statistical Significance is used to evaluate the trend<br>over 4 to 10 periods of measure, subject to data availability and comparability.
County/City: Fairfax City Population Over Age 65
County/City: Fairfax City Population Over Age 65
14.3%
(2022)
Compared to:
VA Value
(16.9%)
The regional value is compared to the Virginia State value.
US Value
(17.3%)
The regional value is compared to the national value.
Prior Value
(14.4%)
Prior Value compares a measured value with the previously measured value. Confidence intervals were not taken into account in determining the direction of the comparison.
Trend
This comparison measures the indicator’s values over multiple time periods.<br>The Mann-Kendall Test for Statistical Significance is used to evaluate the trend<br>over 4 to 10 periods of measure, subject to data availability and comparability.
County/City: Fairfax City Population Over Age 65 (Count)
County/City: Fairfax City Population Over Age 65 (Count)
3,498
People
(2018-2022)
Compared to:
Trend
This comparison measures the indicator’s values over multiple time periods.<br>The Mann-Kendall Test for Statistical Significance is used to evaluate the trend<br>over 4 to 10 periods of measure, subject to data availability and comparability.
County/City: Fairfax City Population Two or More Races
County/City: Fairfax City Population Two or More Races
4.1%
(2022)
Compared to:
VA Value
(3.4%)
The regional value is compared to the Virginia State value.
US Value
(3.0%)
The regional value is compared to the national value.
Prior Value
(3.9%)
Prior Value compares a measured value with the previously measured value. Confidence intervals were not taken into account in determining the direction of the comparison.
Trend
This comparison measures the indicator’s values over multiple time periods.<br>The Mann-Kendall Test for Statistical Significance is used to evaluate the trend<br>over 4 to 10 periods of measure, subject to data availability and comparability.
County/City: Fairfax City Population Under Age 18
County/City: Fairfax City Population Under Age 18
25.1%
(2022)
Compared to:
VA Value
(21.5%)
The regional value is compared to the Virginia State value.
US Value
(21.7%)
The regional value is compared to the national value.
Prior Value
(23.6%)
Prior Value compares a measured value with the previously measured value. Confidence intervals were not taken into account in determining the direction of the comparison.
Trend
This comparison measures the indicator’s values over multiple time periods.<br>The Mann-Kendall Test for Statistical Significance is used to evaluate the trend<br>over 4 to 10 periods of measure, subject to data availability and comparability.
